Build a data hypothesis for your next story
Conversations with Data: #78
Do you want to receive Conversations with Data? Subscribe

Welcome to our latest Conversations with Data newsletter.
This week's episode features data journalists Eva Constantaras and Anastasia Valeeva, who joined us for a live Discord chat earlier this month. Drawing on their vast global experience of teaching data journalism, we discussed the power of using hypothesis-driven methodologies to tell data stories about hidden or forgotten communities.
You can listen to the entire podcast on Spotify, SoundCloud, Apple Podcasts or Google Podcasts. Alternatively, read the edited Q&A with Eva Constantaras and Anastasia Valeeva below.
What we asked
Talk to us about how you define what a data hypothesis is.
Eva: A hypothesis is an affirmative statement that can be proven true or false with data. So instead of starting with sort of a general overall question, you start with your theory and then use data to prove your theory, true or false. I have adopted this approach because a few years ago, I came across Mark Lee Hunter's book, "Story-Based Inquiry", which is actually a manual for investigative journalism, but it has a much wider applicability. He had one tip in that manual that really addressed many of the concerns that I had been having when I was teaching data journalism. He says a hypothesis virtually guarantees that you will deliver a story and not just a massive data.
What I saw a lot of in data journalism stories was less story and more data. So instead of delivering a concise, coherent set of information that could help citizens make better decisions in their lives, a lot of data journalism was presenting this massive data. To apply this approach, you must do your research, build a carefully constructed hypothesis and then focus your analysis on answering questions that can prove that hypothesis, true or false. In a nutshell, that's the idea of developing a data-driven hypothesis for this and leading a story-based inquiry approach when teaching data journalism.
How can a data hypothesis-based approach help unearth those untold stories about forgotten communities?
Anastasia: I found this data hypothesis approach to be very helpful, not only for teaching data journalism but also for mentoring journalists. This is because it helps divide the whole process of working on a story into measurable steps. You can prove or disprove each question that ultimately builds up into a broader hypothesis. When Eva and I have taught data journalism together around the world, the main challenge has been to explain to journalists what a data hypothesis is.
When data journalism is taught, often skills are the focus, and less emphasis is placed on critical thinking with data. But this is exactly where journalism comes in. We try to explain to our students that these data can help you find systemic biases and prove inequity in society. This very often depends on the statistics and how they are provided. Often the data is not very granular, but even if you have a sex-disaggregated data set, you can build a hypothesis. One could be females being disadvantaged in certain areas or males being disadvantaged in other areas.
What motivated you to create a manual for teaching data journalism?
Eva: What Anastasia just mentioned was what I was finding to be true. So when data journalism was being taught, journalists were learning how to build maps using California wildfire data, they were using OpenRefine to clean data looking at candidates running for New York City Council. So journalists were being taught full entirely out of context with data that didn't relate to their own work. I believe there was a backlash against data journalism because donors and media houses were investing a lot of money in what I call the "data journalism bootcamp model". For instance, in one week, we're going to introduce a bunch of data journalism tools to you and then go take them back to your newsroom and produce brilliant data journalism pieces.
I think part of that came out of Meredith Broussard's concept of "technochauvinism", the idea that technology will somehow solve all of our issues. So my starting point was, yes, the tools are important. But what is most important is the process. The journalists need to learn how to follow a research methods process to realise the story they've wanted to investigate.
How do you begin this process of teaching data journalism with this methodology?
Eva: I would start with journalists who are really passionate about their beat. Technical skills aren't that important. We would then discuss, based on the data we have, what hypothesis can be developed. And from that hypothesis, then we would then break it down into question categories. So once you have a hypothesis, how are we going to measure the problem with data? How are we going to measure what populations have been impacted by data? How are we going to measure the cause of the issue with data? How are we going to measure the solution? Once we bring in all those data sets and have all of those interview questions for our data, we're almost guaranteed to find a story at the end of the process.
The reality is that many of these newsrooms will not have the resources to have someone do data visualisation, have another person do the analysis, and another do a regression model. So with the resources we have, what kind of data-driven stories can come out of it? My methodology is based on how we use data to uncover these systemic issues, whether it's health care inequity or education inequities. In that case, it's less important to have granular data and more important to have very clear in your mind how you're going to approach this question and what specific area you're going to tackle through a hypothesis.
Anastasia: We worked in a critical period in Kyrgyzstan and Albania, where we completely fleshed out this programme, and it became a 200-hour course. So that's a five-week full-time course in total. So far, we've both taught it in other countries like Pakistan and Jordan. We've done part of it in Myanmar. The idea is that we're adapting to the realities of the data environment. We're creating a process for motivated journalists who really are passionate about the topic they're covering to have a way to produce data stories independently after they go through this programme. That's also why I stayed in Kyrgyzstan because I felt that even 200 hours is not enough, and I really wanted to make it work.

How do you adapt your data journalism training for audiences in the Global South?
Eva: At present, I'm teaching a data journalism course for the Mekong region. We are working with two organisations, Thibi and Open Development Cambodia, data consultants based in Myanmar and Cambodia, respectively. We spent quite a lot of time localising the manual. We localised it for the country or the region, and then by the sector. You can't learn data journalism from start to finish if you're jumping around from economic data to education data to environmental data. Early on in the process, we choose a sector or thematic focus, and then we localise all the content.
Half of the content is devoted to the journalism and the analytical skills research methods side. The other half is tool based. We realised that without localising it, these journalists would never be able to go through the entire data pipeline and data storytelling process and understand how to do it independently. That's why it is worth the investment and to slow down the training so that they're able to practise each of the skills.
Anastasia: Localising the content for the context is very important. It takes several days to study the local agenda, the local data sets and to use meaningful examples for the training. So it's not an easy process. I usually go to the local statistical agency website and start digging through to see what data is available and how it can answer some of the issues discussed in the news agenda.
This is how ideas are born. Once you show these journalists what is possible and apply it to their news coverage, they start thinking this way. Many people come to data journalism thinking that they will work with big data or do interactive visualisations. But what we teach is not really about that. It's more about finding the systemic biases and inequities in society.
What digital security precautions do you take when training data journalists in high-risk countries?
Eva: The one thing that we've actually found, and I first discovered this in Kenya, was that telling an investigative story with data, especially if it's data that's been made public by the government, can actually be safer than traditional forms of investigation. We try to stay away from leaked data and avoid having to hack sites to get the data we need. But we work with the data that's in the public domain or that we can get through FOIA requests. There are two advantages to that. There are very few data journalists in the country, which means nobody has actually explored this data. The second is if they're analysing publicly available data, the story they can find can be much safer to publish because it's much more difficult for the government to criticise a source originally from them.
When you pitch a data journalism story to an editor, how much of your hypothesis should you explore and develop on your own before sending in your pitch?
Eva: That's a good question. Often the biggest barrier for data journalists to do data journalism in the newsroom are editors. We see many problems with editors trying to embrace this idea of long-form or explanatory reporting around a specific beat or subject. Try to demonstrate to the editor that you have an evergreen topic, your initial hypothesis and several other hypotheses that you could explore going forward. For instance, that could be a series on crime or unemployment. I would try to show the editor that not only do you have a sound hypothesis, but you have a plan for how your time investment is going to pay off for them in the long term. Demonstrate that it's not just a one time burst of effort for one high profile story, but you have a plan for making them sustainable in the long term.
Anastasia: I would say it really depends on the context. For instance, in Central Asia, oftentimes, the editor would not have worked with data journalism before. So it is important to ensure everybody understands what it is and is on the same page to create a dialogue between the journalist and the editor. So that's why we also try to engage editors in some of our training sessions. This allows them to understand the methods of data journalism and the amount of time required to tell a data story. Journalists need to have done their background analysis -- a key part of Eva's manual.
Finally, what are some of the big misconceptions you encounter from journalists new to data storytelling?
Eva: The most common misconception is that the tool is going to do the thinking for you. Often there's this notion that if you just combine the data and the technology, somehow, a story is magically going to emerge. So I think going in with the attitude that somehow data will make the storytelling process easier is a pretty common misconception. Another common mistake I see is wanting to jump straight to the visualisation. It's important to understand you need to have a solid analysis underlying your visualisation beforehand. We have to instil the idea that data can be quite tedious but rewarding because of the stories you uncover. Data journalism is a lot of trial and error -- learning these tools and doing a lot of research to pick up the skills you need to tell the story you want to tell.
Anastasia: One big stereotype about data journalism is that it always involves working with big data. In our training, we spend some time discussing what big data is and what it isn't. When we teach data journalism, we often start by working with small data. Another area of concern is when people download and start digging into a dataset and immediately begin drawing out random conclusions. In the end, this doesn't make a story. All this does is provide a description of the data set. That is why the hypothesis method is useful -- it shows you how to interpret the story, to lead the exploration with questions, not just randomly perform calculations on the data set. Attaching human meaning to the data is something that is a skill to be learnt.
Latest from DataJournalism.com
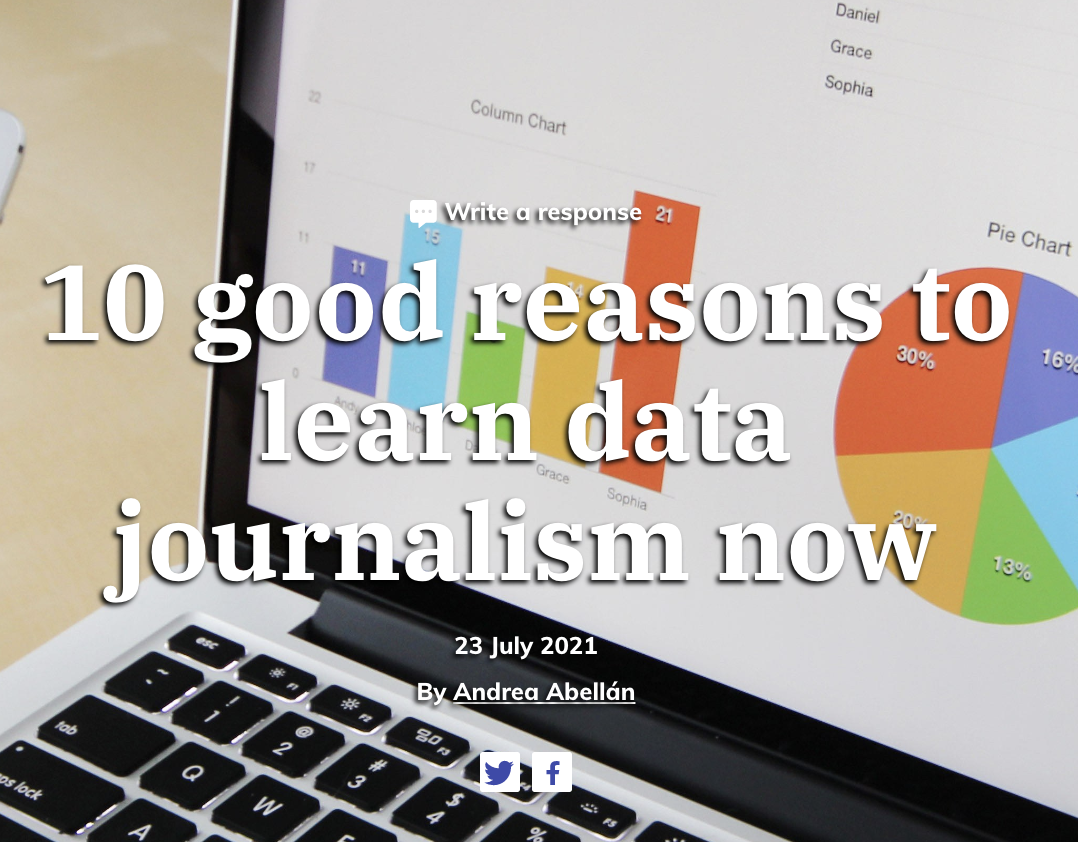
If you have ever wondered why you should include data in your reporting, read our latest blog post. DataJournalism.com's Andrea Abellan outlines 10 reasons to invest in telling stories with data. We also link to some useful resources to help you get started.
Spreadsheets are the backbone of data journalism. To help journalists unlock hidden stories from those imprisoned cells, read Abbott Katz's long-read article. Drawing on data from ProPublica and the European Centre for Disease Prevention and Control (ECDC), he provides mini-tutorials to help you use spreadsheets at speed. Read the full article.

Our next conversation
Our August conversation will feature Marie Segger, a data journalist at The Economist. She will speak to us about launching "Off the Charts", The Economist's data newsletter. We will also hear about her learning and career path into data journalism as well as her thoughts on the best way for data teams to collaborate.
Latest from European Journalism Centre
GNI Startups Lab Europe is open for applications! Created in partnership with the Google News Initiative (GNI), Media Lab Bayern, and the European Journalism Centre (EJC), the programme supports early stage news organisations with workshops, coaching, high-profile networking opportunities and up to €25,000 in grants for running revenue-generating experiments. Are you ready to grow your digital news business? Apply by 20 September 2021.

As always, don't forget to let us know who you would like us to feature in our future editions. You can also read all of our past editions here or subscribe to the newsletter here.
Onwards!
Tara from the EJC data team,
bringing you DataJournalism.com, supported by Google News Initiative.
PS. Are you interested in supporting this newsletter or podcast? Get in touch to discuss sponsorship opportunities.
Time to have your say

Sign up for our Conversations with Data newsletter
Join 10.000 data journalism enthusiasts and receive a bi-weekly newsletter or access our newsletter archive here.
Almost there...
If you experience any other problems, feel free to contact us at [email protected]