Let’s face it: you’d rather write a feature than a formula, but when duty calls -- when you need to go one-on-one with a dataset that just might have something important to say to you –- it’s time to break out that spreadsheet, stoke your latte, and hope that you’ve caught the numbers in a seriously good mood. But if not, help is available: Microsoft 365's Excel dynamic array functions and their radically new and powerful take on formulas will help put you and the data on speaking terms.
While you don't need to be an Excel master to understand these new features, you should have a strong grasp of the tool and be comfortable with basic functions and developing formulas to learn from this article and comprehend the mini-tutorials that follow.
True, they took their sweet time in arriving –- Excel heralded the new functions in September 2018, but somehow managed to wait until January 2020 before finding someone home in my hard drive. But now that they’re here, you’ll find that the new functions streamline and ease an array of tasks that would have had you reaching for that pack of cigarettes –- and you don’t smoke.
Defining a dynamic array formula
But first things first: what’s an array formula, what distinguishes them from conventional spreadsheet formulas, and exactly what’s dynamic about this newest iteration?
Good questions. The answer begins to unfold with the recognition that array formulas aren’t quite a next big thing; in fact, they’ve been an entry in Excel’s (and Google Sheets’) catalogue of bells and whistles for quite some time, even if few spreadsheet users have ever turned to that page. But antiquity and obscurity notwithstanding, what you need to know is that an array formula performs multiple calculations that in turn yield multiple results.
Beginning with the basics
Here's a mini walkthrough tutorial to get you started. By way of simple illustration, consider this scenario: we’ve been brought face-to-face with a collection of sales figures, with the Number and Price data populating the range H2:I6 (the headers occupy cells H1:I1):

The activity above triggers the obvious question –- namely, how much money has this grocer managed to ring up? The standard means toward the answer would have us enter this formula in cell J2:
=H2*I2
After which we’d copy that elementary expression down the J column for another four cells, mustering five rows’ worth of sales in toto. We’d then finalise the business by inscribing a SUM formula somewhere, realising a bottom line of £48.52 as shown in the video below.
The total formula count: six.
Now whilst you probably didn’t need me to march you through those rudimentary paces, keep in mind that if our worksheet had been stuffed with 50,000 rows worth of transactions instead -– a not inconceivable prospect –- we’d require 50,001 formulas before we’d alight atop the bottom line: 50,000 instances of multiplication, one for each and every Number times Price, and one SUM to hoover them all into the grand total.
Now consider Plan B: the array formula alternative to our original, five-row multiply-and-sum challenge as demonstrated in the following video:
{=SUM(H2:H6*I2:I6)}
Trimming your formula to one single cell
You can probably see where the formula has taken the math. The two contributory ranges -- the ones bearing the numbers of items and their prices -- are lined up, each pair of values in their respective rows is multiplied internally somewhere in the formula’s cerebrum, and they’re all finally enwrapped by the SUM function that at last ushers the result to the worksheet.
In other words: the array formula -- in the singular -- crunches the multiple results and adds them all. The revised formula count: one replaces the original six.
And were we called upon to add up 50,000 rows worth of sales, the complement of array formulas we’d have to earmark for the task -- once you get the range references right, of course -- remains the selfsame, solitary, one:
{=SUM(H2:H50001*I2:I50001)}
Powerful stuff, then, these array formulas. True, they take a bit of getting used to, forcing as they do a dramatic trimming of the conventional formula-writing script. After all -- arrays do all the heavy lifting in a single cell, but scaling their learning curve is worth the trip.
But what about those curly braces? That er….brace -- of punctuations automatically surrounded pre-365 array formulas once they were inducted into their destination cells.
And tucking them into those cells obliged the user to do more than tap the standard Enter key; rather, what was called for was a curious, if legendary, triad of strokes: Ctrl-Shift-Enter, only after which would the formula barge into its cell, and the curly braces would clamp themselves around it. (The faux alternative wouldn’t work, by the way: the braces couldn’t merely be typed.)
What's new in Microsoft 365's Excel?
It was all rather quirky, perhaps, and all rather ancien regime, too; because with Microsoft 365 Excel came the dynamic array revolution, and with it a round of insurgent decrees, e.g:
Ctrl-Shift-Enter has been abolished. Now, all Excel formulas, including the most abstruse array concoctions, are delivered into their cells via a familiar, no-frills press of the Enter key.
And that means the curly braces are gone, too, sheared from any and all array formulas.
And moreover -- and this is the heart of the matter -- a single dynamic array formula can spawn a range of multi-cell results, a possibility that is utterly new to Excel.
By way of exemplification, recall the sales calculation we stepped through a few paragraphs ago. I stated that the inaugural formula H2*I2 inlaid in cell J2 -- the formula that totalled the first transaction -- would then have to be copied down the J column, preparing each succeeding transaction to be figured in its row. But with dynamic arrays we need only enter this formula in J2:
=H2:H6*I2:I6
And nothing else. The above expression will multiply every number by every price and post each result in its appropriate cell in the J column. And for Excel, that’s unprecedented. This video below shows how that's done.
One formula, boundless results
What we’re seeing is what Excel calls a spill range, the stream of cells loosed down the worksheet by the array formula’s nascent, extended reach. The dynamic array capability empowers users to write exactly one formula that can propagate thousands, or even hundreds of thousands, of results down and/or across a like number of cells, should their data-analytic needs call for them. And they’re dynamic because, if you organise the data properly, the spill range will wax and wane if you enter new records to the dataset, delete existing ones, or rewrite the formula (as you’ll see below).
And in keeping with its remit, Excel has rolled out a line of new functions programmed to channel the dynamic array spirit, ones that free you to do some pretty cool and efficient things.
Putting dynamic array spirit in action: ECDC case study
Start with the UNIQUE function, which, befitting its name, winnows redundant data in a field to a set of single instances and collects them all in a spill range.
To appreciate UNIQUE’s utility and elegance, consider the spreadsheet managed and updated by the European Centre for Disease Prevention and Control that tracks the accumulation of COVID-19 cases by country and continent.
In excerpt, the data look like this:

If we set out towards the most self-evident objective -- namely, a summing of cases by country -- a problem immediately congests the route.
We want to see a column’s worth of country names, adjoined by a column of corresponding case totals (we’d tabulate these via a standard function such as SUMIF, embellished by a dynamic function fillip); but because the ECDC data records and remembers the figures for each week from January 2020, each country name recurs dozens of times, even as we want them put before us but once.
Combing the data with UNIQUE function
And that’s where UNIQUE comes in. Assuming we’ve range-named the Country column Country, all we need do is check into a cell and write therein:
=UNIQUE(Country)
We see, in excerpt:
UNIQUE combs the data for every country name and pares the occurrences of each to one. Again: one formula, a multi-cell result.
Pretty neat –- literally; and if you don’t appreciate UNIQUE’s minimalist cunning, compare the formulaic equivalent offered by the pre-365 versions:
{=INDEX(country,MATCH(0,COUNTIF(O$9:O9,country),0))}
And you aren’t done there, either; once written, you’ll need to copy it down its column for as many country rows as you think you need, something you won’t know in advance.
But don’t be fooled just the same; elegance notwithstanding, UNIQUE won’t automatically sort the output it stacks down the column. The sort you see above is an artifact of the ECDC’s own, prior alphabetising of the source data; had the entries not been so arranged, UNIQUE would simply have presented them as they appeared from top to bottom among the records. Thus, if we were to apply UNIQUE to the data in the Continent column instead (range name Continent):
=UNIQUE(Continent)
The formula would drum up the following as shown in the video below:
Marrying SORT and UNIQUE functions
And that disordered outcome cries out for the SORT function, another arrow in the dynamic array quiver. If we wrap SORT around UNIQUE:
=SORT(UNIQUE(Continent))
As shown in the video below, you’ll find Africa lifted to the first position, and so on. (SORT also has a first cousin, SORTBY, that executes multi-column sorts.)
Pinpoint a data story with speed: ProPublica case study
By way of extended demonstration, we can also productively deploy UNIQUE at ProPublica’s compendium of civilian complaints levelled at New York City police officers, which in an excerpt read like the following screenshot:

The dataset archives over 33,000 complaints, but doesn’t answer this question: exactly how many individual, discrete officers were implicated by an aggrieved civilian?
The number is doubtless smaller, but that conjecture won’t suffice. So let’s reprise UNIQUE. Understanding that the first field in the data set, unique_mos_id, divulges the officers’ distinctive ids, we can enter, somewhere in the worksheet:
=COUNT(UNIQUE(unique_mos_id))
The virtues of COUNT
For the record, the count is 3996, conducing towards a complaints-per-officer average of somewhat more than eight.
But if you’ve been clicking along with me you’ll note that, in spite of all of the multi-cell derring-do that UNIQUE’s been orchestrating to date, only one cell spills from the expression above. That’s because the venerable COUNT function gathers and confines all the unique ids into the innards of its formula, keeps them there, and counts them there.
COUNT is known as an aggregating function – it inhales a range of values and simply counts them. And a count, when reported, simply requires one cell. But make no mistake; the unique officer ids have been generated, nevertheless – they’re in there, holed up in the formula, where they’ve been counted by the single-minded, single-celled COUNT.
Drilling down the data with FILTER
But it’s when you've cleared out some space in your skillset for the dynamic array FILTER function that you’ll really able to walk the walk with your data. FILTER does what it says on the tin; it carves out subsets of your data per a criterion or criteria you supply, and serves the results up with a facility that can’t be matched by the Filter tool, i.e.
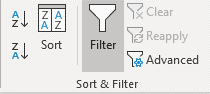
A filter tool used in Excel appears above.
Just nail down a few of its none-too-daunting formula basics and FILTER will rise to the top of your to-go-to function list.
Two examples, both drawn from the ProPublica data, should affirm the virtues of FILTER: we could ask, for starters, about the number of complaints filed against women officers (we’re assuming throughout that all fields have been range-named after their headers, and that the entire dataset has been named All).
To avoid a messy conflation of FILTER with the source data, I’ll move into a new, pristine worksheet and enter, say in cell C4, the letter F for female (as it’s represented in the mos_gender field). Next, say in C10, I’ll write the following expression:
=FILTER(All,mos_gender=C4)
Translation: Extract, or filter, all those records in the dataset whose code in the mos_gender field reads F.
In excerpt, the results look like this in the below video:
I’ve coloured cell C10 yellow – the one and only cell in which I’ve written a formula – the better to highlight FILTER’s one formula/multiple-cell potency. The 1760 records harvested here mean that a bit more than 5% of the civilian complaints arraigned women officers; but of course, if you substitute M for F in cell C4 you’ll trigger the 31598 complaints brought against male officers instead.
Either way, it’s the same formula that’s promulgating these disparate outcomes -- and that’s what they mean by dynamic. It also means that if you delete that formula in C10, all the results it’s unleashed will disappear.
And now for the follow-on question regarding complaints against New York City police officers: Exactly how many unique women officers incurred at least one complaint?
We’ve already compiled the overall count of the 3996 officers who were named, but because here we want to restrict the question by gender, the ensuing formula calls for a slightly more intricate expression. Continuing to reference gender in cell C4 -- again, the code F -- I can write:
=COUNT(UNIQUE(FILTER(unique_mos_id,mos_gender=C4)))
See the following video of the formula below:
This formula partners three functions, FILTER, UNIQUE, and COUNT and works this way:
- It filters all 33,000 records by the gender code F as denoted in the mos_gender field;
- It then proceeds to sieve unique instances of each remaining unique_mos_id (all of whom are women);
- It then counts the records that remain.
The result -- 387 actual women officers -- could then be subtracted from the global 3996 officer count, leaving us with the 3609 unique male officers who were likewise incriminated by complainants. But we could have also applied our formula to that task as well -- by simply substituting an M in cell C4 for F. And if you’re ever-so-slightly daunted by the formula, try writing it in a pre-365 version of Excel.
But FILTER can do more, much more. For one thing, it can launch queries that plumb the data by multiple criteria. For example: suppose we wanted to view the records of complaints filtered both by gender and year, e.g. all complaints registered against male officers in 2013. If we retain cell C4 for the gender coding, enter M there, and key in 2013 in say, C5, we could then write:
=FILTER(all,(mos_gender=C4)*(year_received=C5))
Note the new syntactical bits rushing into play here. When you nail several criteria into FILTER, each is enveloped by brackets (parentheses, in my part of the world), and they’re made to interact by interpolating an asterisk between them (what’s going on here beneath the formula’s bonnet is a storyline for The Sequel to this article). Get the jots and tittles right and you get the answer, something like this in excerpt:
Male officers, circa 2013, as noted in the following video:
Keep in mind that more complex permutations of FILTER will hand you the spade that’ll let you dig deeper into the data, though you do need to remember that the first encounter with Excel’s more baroque formulas, array or otherwise, can leave the user dazed and confused; but once you hone your spreadsheet chops you’ll be able to more vividly imagine, and liberate, the story possibilities imprisoned inside those cells -- and dynamic array formulas will help the journalist pry open the lock.
A native New Yorker, Abbott Katz currently lives in London. He has taught and trained Excel in diverse settings on both sides of the Atlantic, and has authored two books on the application (Apress). He has in addition contributed variously-themed pieces to New York Newsday, the Times Higher Education, insidehighered.com and other publications, and has a doctorate in sociology from SUNY Stony Brook.


- Data visualisation by hand: drawing data for your next story
- A data journalists guide to building a hypothesis
- Making numbers louder: telling stories with sound
- Conflict reporting with data
- The promise of WikiData as a data source for journalists
- Harnessing Wikipedia's superpowers for journalists
- Own your newsfeed, own your data
- Privacy guide for data journalists

Excel dynamic array functions: what data journalists need to know - A tutorial for journalists to harness spreadsheets at speed
13 min Click to comment