The power of predictive analytics
Conversations with Data: #54
Do you want to receive Conversations with Data? Subscribe
In recent years, data journalists have embraced predictive journalism with open arms. Many news organisations have data teams capable of modelling and telling predictive stories. But incomplete data and poor modelling can hamper any predictive story.
To better understand the challenges, we spoke with Leonardo Milano who leads the predictive analytics team at the United Nations OCHA Centre for Humanitarian Data. He discusses how the humanitarian community is using predictive modelling and projections to anticipate, respond and prepare for emergencies around the world.
You can listen to our entire podcast on Spotify, SoundCloud or Apple Podcasts. Alternatively, read the edited Q&A with Leonardo Milano below.
What we asked
Let's start with the basics. How do you define predictive analytics?
Predictive analytics is about making use of current and historical data to understand what is likely to happen or estimate some characteristics of an event that is likely to happen. However, the field is very broad. For instance, predictive analytics is not only about us estimating precisely a number that may be successful. It also supports decisionmaking with analytical tools. To be effective, predictive analytics requires the best data and contextual knowledge available on a given issue.
Tell us about the Centre for Humanitarian Data.
The Centre for Humanitarian Data is part of the United Nations Office for the Coordination of Humanitarian Affairs (UN OCHA). The overall goal of the centre is to increase the use and the impact of data in the humanitarian sector. We believe that connecting people and data has the potential to improve the lives of the people that we are trying to assist in humanitarian emergencies. We manage the Humanitarian Data Exchange (HDX), which is an effort to make humanitarian data easy to find and use for analysis. Launched in July 2014, HDX is as a growing collection of data sets about crises around the world. It's accessed by users in more than 200 countries and territories.
How do you define humanitarian data?
Humanitarian data is defined in three different categories. Firstly, humanitarian data is data about the context where a humanitarian crisis is occurring. The second category is data about the people affected by the crisis and their needs. Lastly, it is defined as data about the response from organisations and people seeking to help those who need assistance. For instance, this could be a set of different interventions promoted by the government to respond to a humanitarian crisis. Alternatively, this could be mapping areas with humanitarian access constraints because of insecurity or ongoing conflict.
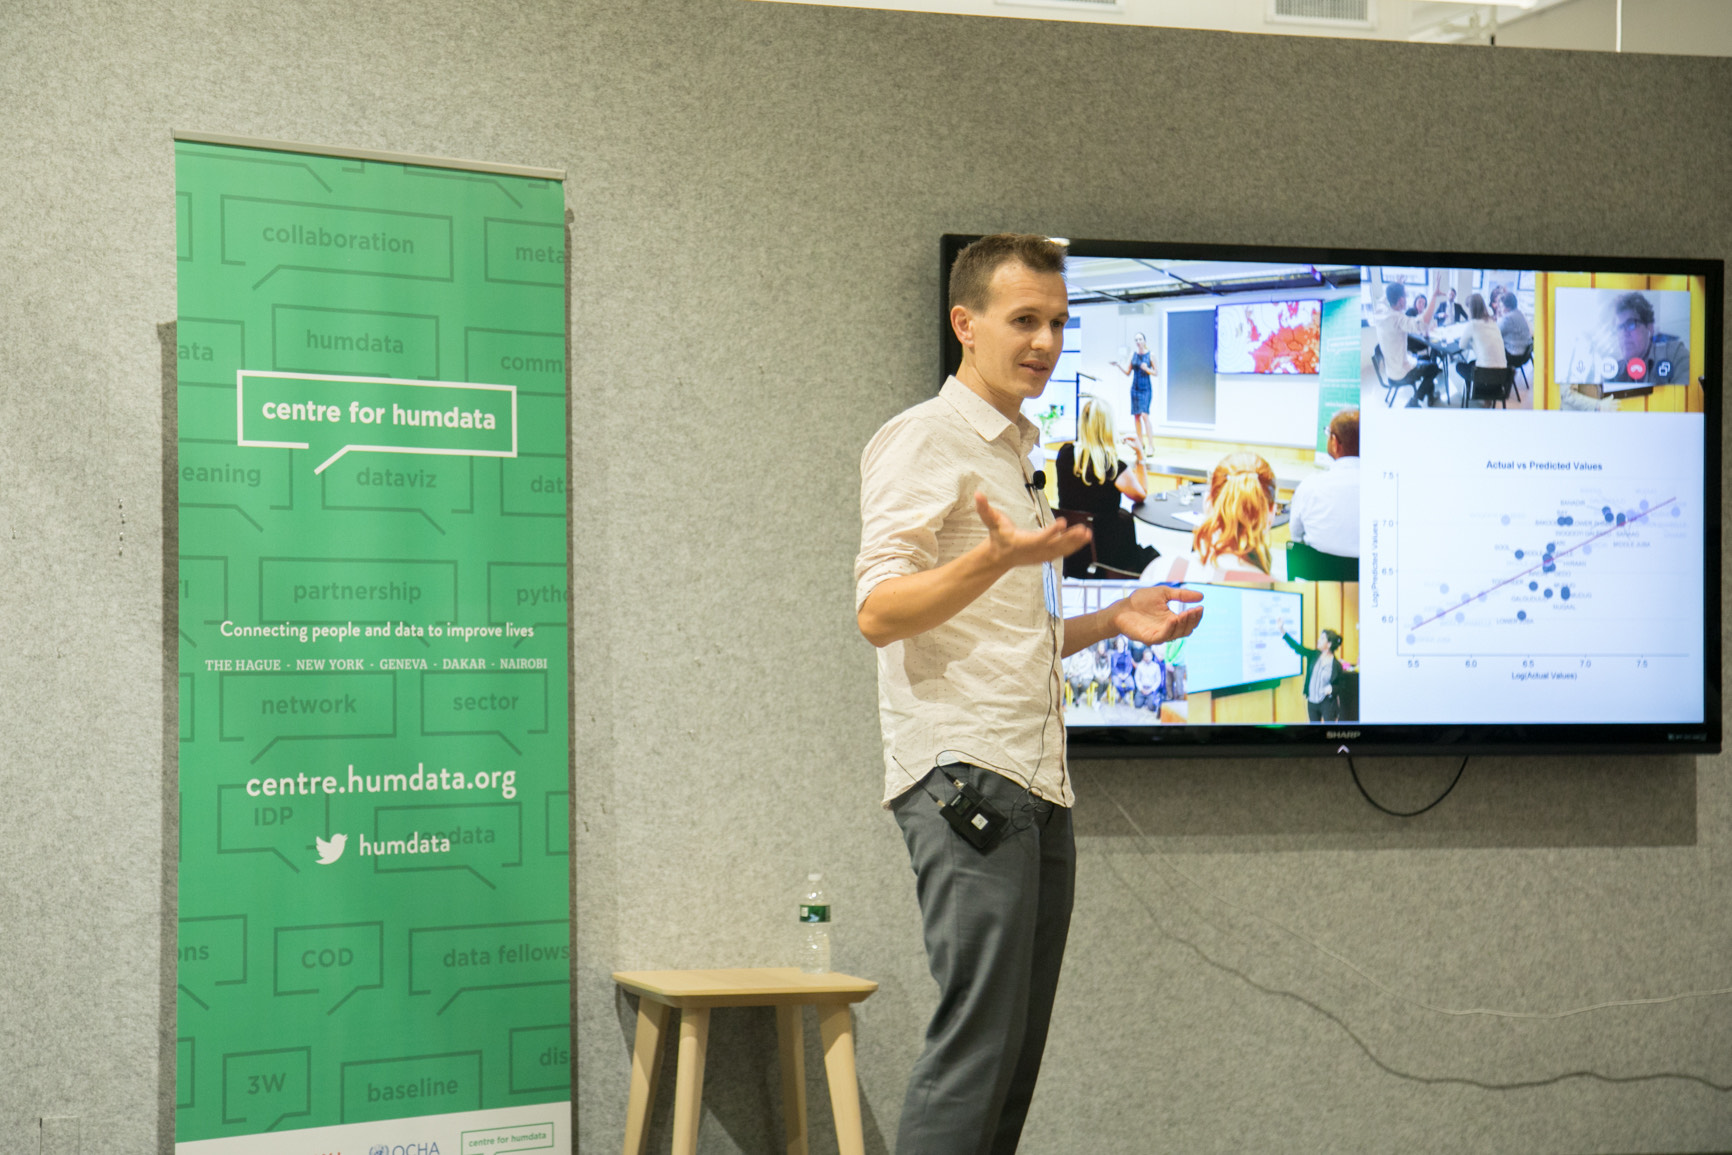
Leonardo Milano leads the Predictive Analytics team at the United Nations OCHA Centre for Humanitarian Data. His team provides support to the humanitarian community around the development, evaluation, validation and application of data science tools to better inform humanitarian response.
What is the biggest misconception people have about predictive analytics?
The biggest misconception is that people believe predictive analytics in the humanitarian sector is mainly a technical challenge. The technical aspect of developing a model is actually the least challenging part. So first of all, you need to obtain the required data and understand its scope and limitations. This is highly complex in a humanitarian context where data is collected in a very challenging environment. Next, you need to understand the use case and design a model that is fit for purpose. And the last one is communication. There is still a disconnect between policymakers, decision-makers and technical partners.
What tools and advice do you provide for those working in this field?
Our goal is to make all humanitarian data available, easy to navigate and analyse. This includes data coming from more than 1,200 sources. The Humanitarian Data Exchange has more than 100,000 users per month and almost 20,000 datasets are shared as of today. About a third of our users are based in field locations. People do download datasets, but they also explore the data through many different data visualisations that our team creates. We also provide other data-related services. For instance, we added a new data grid feature in 2019 to help users understand what data is available and missing across the top humanitarian crisis data.
What should journalists be aware of when referencing models and projections in their stories?
It's important to understand who developed the model and why. First of all, understand the use case and why this model and these projections were produced in the first place. The scope of the projections and the eventual limitations are also essential to grasp. Be sure to read the methodology and footnotes explaining the assumptions and its limitations. These are extremely important because this is where the team who developed the model may add important biases that would be reflected in the projections.
I understand the Centre for Humanitarian Data is partnering with the Rockefeller Foundation. Tell us about it.
The Centre for Humanitarian Data is partnering with The Rockefeller Foundation to increase the use of predictive analytics to drive anticipatory action in humanitarian response. The work will focus on developing new models, providing a peer review process, and closing data gaps.
Lastly, tell us about the report that you're working on with Johns Hopkins University and Rockefeller Foundation.
The goal of this report is to support our colleagues in the field estimating the scale, the severity and the duration of COVID-19 outbreaks in countries with major humanitarian operations. By working with the Johns Hopkins University Applied Physics Laboratory, we have developed an initial COVID-19 model for Afghanistan. We have extended this model to other priority countries such as the Democratic Republic of the Congo, South Sudan and Sudan.
While there are numerous models available on COVID-19, there is very little information available to inform humanitarian response interventions. We aim to provide additional insights into the current COVID-19 crisis in the humanitarian context. The report will be released in the coming weeks ahead of the expected peak of COVID-19 in these countries.
Latest on DataJournalism.com
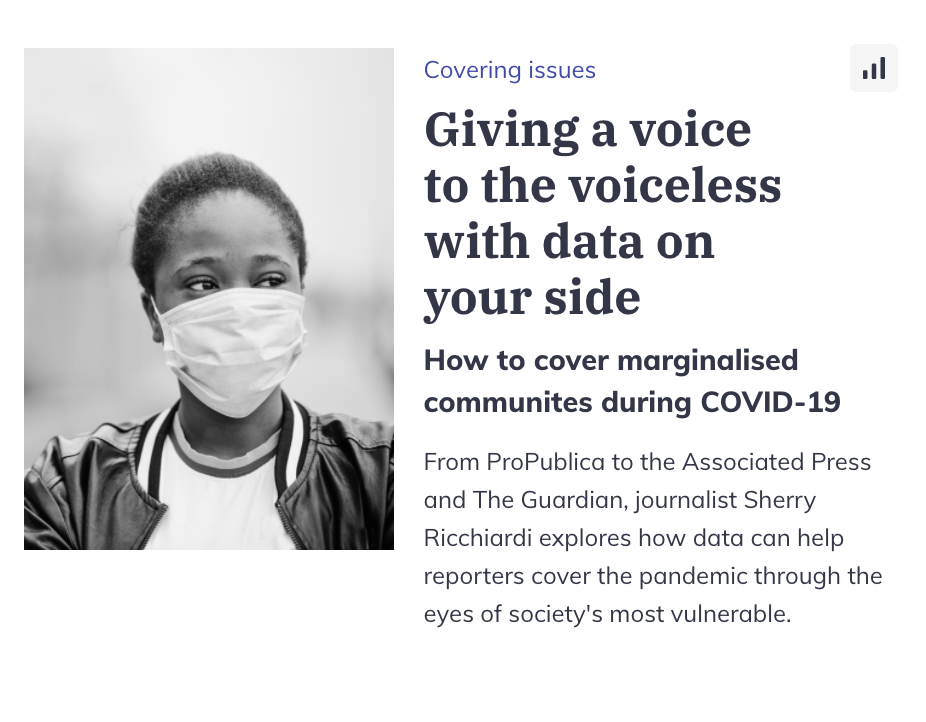
Journalist Sherry Ricchiardi explores how reporters can tell stories about the impact COVID-19 is having on society's most marginalised and vulnerable groups. From The New York Times to the Associated Press and The Guardian, our latest long read article cites useful resources and examples of data-led storytelling.
Our next conversation
In the next episode of our Conversations with Data podcast, we'll look at machine learning in the newsroom. The discussion will focus on how it can help make data journalists more efficient and speed up news production.
As always, don’t forget to let us know what you’d like us to feature in our future editions. You can also read all of our past editions here.
Onwards!
Tara from the EJC Data team,
bringing you DataJournalism.com, supported by Google News Initiative.
P.S. Are you interested in supporting this newsletter as well? Get in touch to discuss sponsorship opportunities.
Time to have your say

Sign up for our Conversations with Data newsletter
Join 10.000 data journalism enthusiasts and receive a bi-weekly newsletter or access our newsletter archive here.
Predictive analytics has grown in popularity in the healthcare and medical research communities but perhaps nothing has inspired this growth more than the COVID-19 pandemic. As doctors and researchers look for ways to understand the virus and predict outcomes, infections, etc. the field of predictive analytics has exploded. At Smarten we find that our clients have a need to adopt and use these tools across all groups and want augmented analytical tools that can easily be used by those who are not data scientists to help them to their job in a more meaningful way.
https://www.smarten.com/blog/plug-n-play-predictive-analytics-hospitals/