DataJournalism.com Beta
  • Read

    Longform reads

    • This is where data journalists get their ideas from
    • Humanising data: Connecting numbers and people
    • Wrangling the robots: Leveraging smart data-driven software for newsmaking
    • The history of data journalism
    • Bring in the machines: AI-powered investigative journalism
    • The power of data storytelling for lifestyle journalism
    • Investigating troubling content on Amazon
    • Turbulent with a chance of data: Journalism’s drone-powered futures
    All Longform reads
    VERIFICATION HANDBOOK 3 frontsmall image

    Verification Handbook

    For Disinformation And Media Manipulation

    Read online
    DATA HANDBOOK 2 FRONT small image

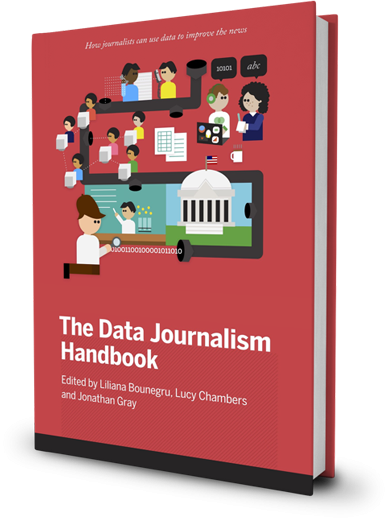
    Data Journalism Handbook 2

    The latest edition explores innovative ways that data is analysed, created, and used in the context of journalism.

    Read online
  • Watch

    New course

    Quality journalism
    Countering hate speech

    Julia Mozer


    All courses

    New course

    Video course
    Fundamental search for journalists

    Vincent Ryan


    All courses

    Popular course

    Coding
    Python for journalists

    Winny de Jong


    All courses
  • Listen
  • Survey
  1. Home
  2. Search

I'm interested in...

  • Read
  • Courses
  • Contributors
  • Comments

Read

map image

Data Handbook 1

  • Beginner
  • 5 min

Data visualization DIY: Our Top Tools

What data visualization tools are out there on the web that are easy to use — and free? Here on the Datablog and Datastore we try to do as much as possible using the internet’s...
Simon Rogers
Novice 20 min

Data collection

Harnessing Wikipedia's superpowers for journalism

Finding hidden data inside the world's free encyclopedia is no easy task for journalists. In Monika Sengul-Jones' long read article, she explains how to navigate the often unwieldy world of Wikipedia.

Monika Sengul-Jones
Novice 7 min

Coversations with Data newsletter

The story behind Datawrapper

This week's newsletter features Charlotte Lisa Rost of Datawrapper. She talks to us about the DataVis Book Club and how the pandemic has changed data visualisation.

Tara Kelly
Novice 9 min

Coversations with Data newsletter

Better data visualisations

This week's Conversations with Data newsletter features economist and data visualisation expert Jonathan Schwabish. He speaks to us about his latest book, "Better Data Visualizations: A guide for Scholars, Researchers, and Wonks".

Tara Kelly
Novice 10 min

Coversations with Data newsletter

Finding data outliers for solutions journalism

In this week's newsletter, investigative data journalist Matthew Kauffman explains how data journalists can apply a solutions-oriented mindset to their reporting to show a path forward to solving society's most pressing problems.

Tara Kelly
Novice 16 min

Data visualisation

Data visualisation by hand: drawing data for your next story

Learn to use data in a creative and inventive way through hand-drawing data visualisations. Dr Amelia McNamara explains how in her latest article.

Amelia McNamara
Novice 14 min

Case studies

Best practices

Making numbers louder: telling data stories with sound

Sonification is all around us. But how can journalists take advantage of it for data storytelling? Miriam Quick and Duncan Geere take us through some compelling examples of how to bring data sonification into your reporting.

Duncan Geere, Miriam Quick
Load More

Courses

Data visualisation
Charting Tools for the Newsroom

Maarten Lambrechts

Data visualisation

  • Beginner
  • 2 hr 32 min

Charting Tools for the Newsroom

Charts and maps have become ubiquitous in todays newsrooms. They convey stories with numbers much better than text alone does and they are shared easily. But not every journalist is a numbercruncher or a graphics designer. And a lot of newsrooms, especially smaller ones, don’t have the means to employ graphic journalists that can craft charts and maps. In this course we introduce and learn to use some tools every journalist can adopt to produce graphics that can support or carry a story.

Maarten Lambrechts
Data analysis
Mistakes We Made So You Don't Have To: Data Visualisation, Journalism and the Web

Jonathon Berlin

Mistakes We Made So You Don't Have To: Data Visualisation, Journalism and the Web

Jonathon Berlin

Resources
Managing Data Journalism Projects

Jacopo Ottaviani

Managing Data Journalism Projects

Jacopo Ottaviani

Best practices
Bulletproof Data Journalism

Stijn Debrouwere

Bulletproof Data Journalism

Stijn Debrouwere

Data collection
Cleaning Data in Excel

Maarten Lambrechts

Cleaning Data in Excel

Maarten Lambrechts

Load More

Contributors

Jonathan Gray profile picture
Jonathan Gray

Senior Lecturer

Dr. Jonathan Gray is Senior Lecturer in Critical Infrastructure Studies at the Department of Digital Humanities, King’s College London, where he is currently writing a book on data worlds. He is also Cofounder of the Public Data Lab; and Research Associate at the Digital Methods Initiative (University of Amsterdam) and the médialab (Sciences Po, Paris). More about his work can be found at jonathangray.org and he tweets at @jwyg.

Liliana Bounegru profile picture
Liliana Bounegru

Lecturer in Digital Methods

Lecturer in Digital Methods at King's College London

Brant Houston profile picture
Brant Houston

Professor and Knight Chair in Investigative Reporting

Brant Houston is an award winning investigative and data journalist who has published textbooks on both. He also is con-founder and board chair of the Global Investigative Journalism Network.

Geoff McGhee profile picture
Geoff McGhee

T. Anthony Pollner Professor

T. Anthony Pollner Professor, @UMJSchool , Faculty advisor @MontanaKaimin. Data vis @TheWaterDesk @WestCenter. Former @jskstanford @nytimes @lemondefr

Load More

Comments

Fantastic article, and a very original approach. Thanks for writing it. I just wonder how things...

Let’s get physical: how to represent data through touch
By Danny Devinsky

I can not believe there are more comments on this. This is a a very informational article that...

Under-reported news
By Danny Devinsky

Fantastic Newsletter issue. Thanks for providing all this for free.

Under-reported news
By Tommy Kenis

Hi, I think it's a very good course for journalists. I only had one concern, since she says that...

Getting started
By Geishy Rondon

Thank you for this article - it made me inspired. I'm a synesthete (seeing colours and shapes of...

Let’s get physical: how to represent data through touch
By Paulina Sajna-Kosobucka

Great motivational introduction.

What is data journalism?
By Gonzalo Robledo

hier steht gar nicht, wer den Artikel geschrieben hat, er war es:...

The Algorithms Beat: Angles and Methods for Investigation
By Malte Hildebrand

Great course! Lessons are really well organized, explanations are clear, and the exercises are...

Scrape data
By Norman Rusin
Discuss

Most searched

  • Verification
  • Spreadsheets
  • European journalism centre
  • Public media
  • Data
  • Data handbook
  • Python
  • Data-analysis
About
  • About us
  • The team
  • Partnerships
  • Branding
  • Contact
Made possible by
  • Write for us
  • Contributors
  • Partners
Useful links
  • Latest discussions
  • FAQ
  • Newsletters archive
Small print
  • Privacy Policy
  • Cookie Policy
  • Terms and Conditions
  • Code of conduct
Social media
  • Twitter
  • LinkedIn
  • Facebook
Created by ejc logo
Supported by ejc logo

Review your cookie settings for the optimal site experience.

Social Features: allows us to show embedded Tweets
Usage Insights: helps us improve the website