Text as Data: Finding Stories in Text Collections
Written by Barbara Maseda
Abstract
How to find data stories in collections of documents and speeches.
Keywords: data journalism, unstructured data, text analysis, text mining, computational journalism
Looking at data journalism production over the past few years, you may notice that stories based on unstructured data (e.g., text) are much less common than their structured data counterparts.
For instance, an analysis of more than 200 nominations to the Data Journalism Awards from 2012 to 2016 revealed that the works competing relied predominantly on geographical and financial data, followed by other frequent types of sources, such as sensor, socio-demographic and personal data, metadata and polls (Loosen et al., 2020); in other words, mostly structured data.1
But as newsrooms have been having to deal with ever-increasing amounts of social media posts, speeches, emails and lengthy official reports, computational approaches to processing and analyzing these sources are becoming more relevant. You may have come across stories produced this way: Think of the statistical summaries of President Trump’s tweets; or visualizations of the main topics addressed in public communications or during debates by the presidential candidates in the US elections.
Treating text as data is no mean feat. Documents tend to have the most varied formats, layouts and contents, which complicates one-size-fits-all solutions or attempts to replicate one investigation with a different set of documents. Data cleaning, preparation and analysis may vary considerably from one document collection to another, and some steps will require further human review before we can make newsworthy assertions or present findings in a way that reveals something meaningful not just for researchers but also for broader publics.2
In this chapter I examine five ways in which journalists can use text analysis to tell stories, illustrated with reference to a variety of exemplary data journalism projects.
Length: How Much They Wrote or Spoke
Counting sentences or words is the simplest quantitative approach to documents. Computationally speaking, this is a task that has been around for a long time, and can be easily performed by most word processors. If you are a student or a reporter who ever had to submit an assignment with a word limit, you will not need any special data training to understand this.
The problem with word counts lies in interpreting the results against a meaningful baseline. Such measures are not as widely known as temperature or speed, and therefore deriving meaning from the fact that a speech is 2,000 words long may not be as straightforward. In practice, many times the only option is to create those baselines or references for comparison ourselves, which may translate into further work.
In some cases, it is possible to find context in the history of the event or speaker you are examining. For instance, for its coverage of the US president’s annual State of the Union address in 2016, Vox calculated the length of the whole collection of historic speeches to determine that “President Obama was among the wordiest State of the Union speakers ever” (Chang, 2016).
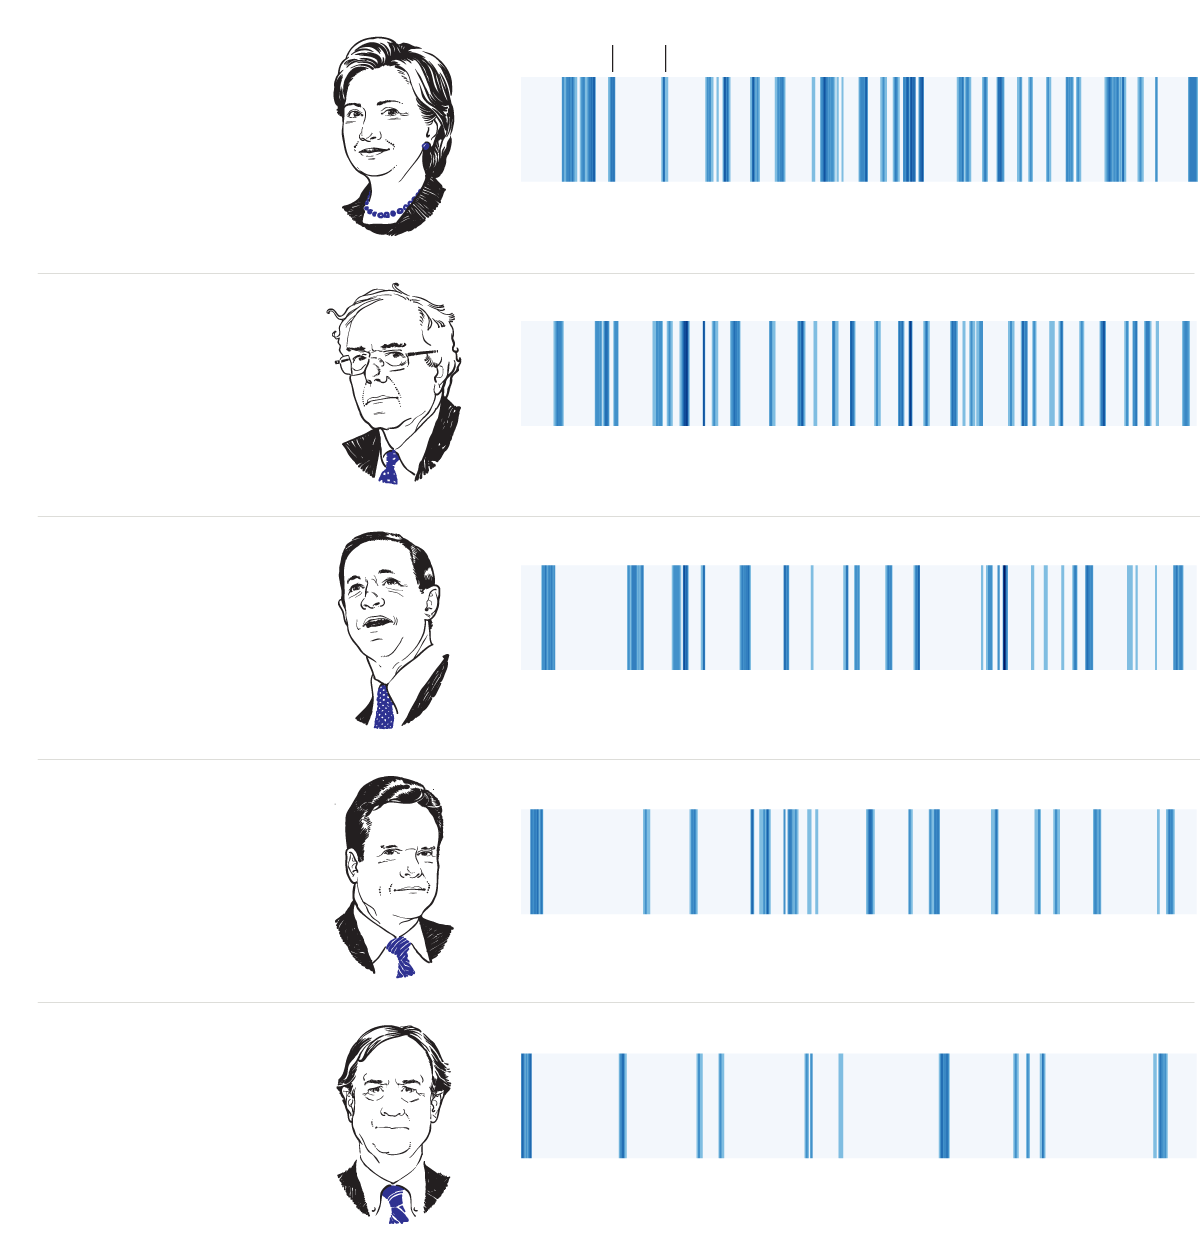
In events involving more than one speaker, it is possible to explore how much, and when, each person talks in relation to the total number of words spoken. For an example, see Figure 17.1.
Mentions: Who Said What, When and How Many Times
Counting the number of times a term or concept was used in speech or writing is another simple task that provides useful statistical overviews of our data. To do this, it is important to make sure that we choose to count the most appropriate elements.
Depending on the questions that you are looking to ask from the data, you may count the repetitions of each word, or of a series of words sharing a common root by using normalization operations such as “stemming” or “lemmatization.”3 Another approach is to focus on the most relevant terms in each document using a weighted measure called “term frequency/inverse document frequency” (TF-IDF).4 The following are a few examples.
Frequent terms and topics. For its coverage of the London mayoral elections in 2016, The Guardian analyzed the number of times the two candidates had addressed various campaign issues (e.g., crime, pollution, housing and transport) in the UK Parliament in the six years preceding the race (Barr, 2016). Topics to be analyzed can be decided beforehand, as in this case, and explored through a number of relevant keywords (or groups of keywords linked to a topic) in comparable or analogous text collections. Search terms can also be analogous and not necessarily the same. Take, for instance, FiveThirtyEight’s analysis of how the same media outlets covered three different hurricanes in 2017 (Harvey, Irma and Maria) (Mehta, 2017). Another approach is to simply look at the most common words in a text as a topic detection strategy.
Speech over time. Looking at speech over time can also be a way to point to topics that have never been mentioned before, or that have not been addressed in a long time. This was, for instance, the approach chosen by The Washington Post for its coverage of the State of the Union address in 2018, in a piece that highlighted which president had used which words first in the history of this event (Fischer-Baum et al., 2018). The fact that readers can very quickly learn that Trump was the first president ever to mention Walmart (in 2017) or freeloading (in 2019), without having to read hundreds of pages of speeches, shows how effective text-data summaries and visualizations can be.
Omissions. A low number or absence of mentions may be newsworthy as well. These omissions can be analyzed over time, but also based on the expectation that a person or organization mentions something in a given context. During the 2016 presidential campaign in the United States, FiveThirtyEight reported that candidate Donald Trump had stopped tweeting about polls when they found a comparatively low number of mentions of keywords related to polling in his posts (Mehta & Enten, 2016). Such omissions can be detected by monitoring the same speaker over time, like in this case, in which, months before, FiveThirtyEight had discovered that Trump was tweeting a lot about polls that were making him look like a winner (Bialik & Enten, 2015). This is also a good example of how news reports based on text analysis can later become the context for a follow-up piece, as a way to address the above-mentioned problem of contextualizing text statistics. The absence of a topic can be also measured based on the expectation that a person or organization mentions it in a given context.
People, places, nouns, verbs. Natural language processing (NLP) tools enable the extraction of proper names, names of places, companies and other elements (through a task called named entity recognition or NER), as well as the identification of nouns, adjectives and other types of words (through a task called part of speech tagging or POS). In The Washington Post piece mentioned earlier, the visualization includes filters to focus on companies, religious terms and verbs.
Comparisons
Determining how similar two or more documents are can be the starting point for different kinds of stories. We can use approximate sentence matching (also known as “fuzzy matching”) to expose plagiarism, reveal like-mindedness of public figures or describe how a piece of legislation has changed. In 2012, ProPublica did this to track changes in emails sent to voters by campaigns, showing successive versions of the same messages side by side and visualizing deletions, insertions and unchanged text (Larson & Shaw, 2012).
Classification
Text can be classified into categories according to certain predefined features, using machine learning algorithms. In general, the process consists of training a model to classify entries based on a given feature, and then using it to categorize new data.
For instance, in 2015, the Los Angeles Times analyzed more than 400,000 police reports obtained through a public records request, and revealed that an estimated 14,000 serious assaults had been misclassified by the Los Angeles Police Department as minor offenses (Poston et al., 2015). Instead of using MySQL to search for keywords (e.g., stab, knife) that would point to violent offenses—as they had done in a previous investigation covering a smaller amount of data—the reporters used machine learning classifiers (SVM and MaxEnt) to re-classify and review eight years’ worth of data in half the time needed for the first investigation, which covered one year only (Poston & Rubin, 2014). This example shows how machine learning approaches can also save time and multiply our investigative power.
Sentiment
Many journalists would recognize the value of classifying sentences or documents as positive, negative or neutral (other grading scales are possible), according to the attitude of the speaker towards the subject in question. Applications may include analyzing a topic, a hashtag or posts by a Twitter user to evaluate the sentiment around an issue, and doing similar computations on press releases or users’ comments on a website. Take, for example, The Economist’s comparison of the tone of party convention speeches by Hillary Clinton and Donald Trump (“How Clinton’s and Trump’s Convention Speeches,” 2016). Analyzing the polarity of the words used by these and previous candidates, they were able to show that Trump had “delivered the most negative speech in recent memory,” and Clinton “one of the most level-headed speeches of the past four decades.”

Becoming a “Text-Miner” Journalist
Using off-the-shelf text mining software is a good starting point to get familiar with basic text analysis operations and their outcomes (word counts, entity extraction, connections between documents, etc.). Platforms designed for journalists—such as DocumentCloud and Overview—include some of these features.5 The Google Cloud Natural Language API can handle various tasks, including sentiment analysis, entity analysis, content classification and syntax analysis.6
For those interested in learning more about text mining, there are free and open-source tools that allow for more personalized analyses, including resources in Python (NLTK, spaCy, gensim, textblob, scikit-learn) and R (tm, tidytext and much more), which may be more convenient for journalists already familiar with these languages. A good command of regular expres- sions and the tools and techniques needed to collect texts (web scraping, API querying, FOIA requests) and process them (optical character recognition or OCR, file format conversion, etc.) are must-haves as well.7 And, of course, it can be useful to obtain a grasp of the theory and principles behind text data work, including information retrieval, relevant models and algorithms, and text data visualization.8
Conclusions
The possibility of revealing new insights to audiences with and about documents, and of multiplying our capacities to analyze long texts that would take months or years to read, are good reasons to give serious consideration to the development of text analysis as a useful tool in journalism. There are still many challenges involved, from ambiguity issues—computers may have a harder time “understanding” the context of language than we humans do—to language-specific problems that can be easier to solve in English than in German, or that have simply been addressed more in some languages than in others. Our work as journalists can contribute to advancing this field. Many reporting projects could be thought of as ways of expanding the number of available annotated data sets and identifying challenges, and as new application ideas. Judging by the growing number of recent stories produced with this approach, text mining appears to be a promising and exciting area of growth in data journalism.
Footnotes
1. For more on the Data Journalism Awards, see Loosen’s chapter in this volume.
2. Data cleaning and preparation may include one or more of the following steps: Breaking down the text into units or tokens (a process known as “tokenization”); “grouping” words that share a common family or root (stemming and lemmatization); eliminating superfluous elements, such as stopwords and punctuation; changing the case of the text; choosing to focus on the words and ignore their order (a model called “bag of words”); and transforming the text into a vector representation.
3. Stemming and lemmatization are operations to reduce derived words to their root form, so that occurrences of “reporter,” “reporting” and “reported” can all be counted under the umbrella of “report.” They differ in the way that the algorithm determines the root of the word. Unlike lemattizers, stemmers strip words of their suffixes without taking into consideration what part of speech they are.
4. TF-IDF is a measure used by algorithms to understand the weight of a word in a collection. TF-IDF Weight (w, d) = TermFreq(w, d) · log (N / DocFreq(w)), where TermFreq(w, d) is the frequency of the word in the document (d), N is the number of all documents and DocFreq(w) is the number of documents containing the word w (Feldman and Sanger, 2007).
5. www.documentcloud.org, www.overviewdocs.com
6. cloud.google.com/natural-language
8. For further reading, see Speech and Language Processing by Daniel Jurafsky and James H. Martin; The Text Mining Handbook by Ronen Feldman and James Sanger. There are also numerous free online courses on these and associated topics.
Works cited
Barr, C. (2016, May 3). London mayor: Commons speeches reveal candidates’ differing issue focus. The Guardian. www.theguardian.com/politics/datablog/2016/may/03/london-mayor-data-indicates-candidates-differing-focus-on-issues
Bialik, C., & Enten, H. (2015, December 15). Shocker: Trump tweets the polls that make him look most like a winner. FiveThirtyEight. fivethirtyeight.com/features/shocker-trump-tweets-the-polls-that-make-him-look-most-like-a-winner/
Chang, A. (2016, January 11). President Obama is among the wordiest State of the Union speakers ever. Vox. www.vox.com/2016/1/11/10736570/obama-wordy-state-of-the-union
Feldman, R., & Sanger, J. (2007). The text mining handbook: Advanced approaches in analyzing unstructured data. Cambridge University Press.
Fischer-Baum, R., Mellnik, T., & Schaul, K. (2018, January 30). The words Trump used in his State of the Union that had never been used before. The Washington Post. www.washingtonpost.com/graphics/politics/presidential-lexicon-state-of-the-union/
How Clinton’s and Trump’s convention speeches compared to those of their predecessors. (2016, July 29). The Economist. www.economist.com/graphic-detail/2016/07/29/how-clintons-and-trumps-convention-speeches-compared-to-those-of-their-predecessors
Jurafsky, D., & Martin, J. H. (2008). Speech and Language Processing. Pearson.
Larson, J., & Shaw, A. (2012, July 17). Message machine: Reverse engineering the 2012 campaign. ProPublica. projects.propublica.org/emails/
Loosen, W., Reimer, J., & De Silva-Schmidt, F. (2020). Data-driven reporting: An on-going (r)evolution? An analysis of projects nominated for the Data Journalism Awards 2013–2016. Journalism, 21(9), 1246–1263. https://doi. org/10.1177/1464884917735691
Mehta, D. (2017, September 28). The media really has neglected Puerto Rico. FiveThirtyEight. fivethirtyeight.com/features/the-media-really-has-neglected-puerto-rico/
Mehta, D., & Enten, Ha. (2016, August 19). Trump isn’t tweeting about the polls anymore. FiveThirtyEight. fivethirtyeight.com/features/trump-isnt-tweeting-about-the-polls-anymore/
Poston, B., & Rubin, J. (2014, August 10). Times Investigation: LAPD misclassified nearly 1,200 violent crimes as minor offenses. Los Angeles Times. www.latimes.com/local/la-me-crimestats-lapd-20140810-story.html
Poston, B., Rubin, J., & Pesce, A. (2015, October 15). LAPD underreported serious assaults, skewing crime stats for 8 years. Los Angeles Times. www.latimes.com/local/cityhall/la-me-crime-stats-20151015-story.html
