While many journalists around the world report the daily global death toll and infection rates of COVID-19, audiences are seeking other stories that have a more personal and local impact on their lives. How can journalists use data to tell wider stories about the coronavirus’ impact? From the economy and relationships to mental health, press freedom and privacy, it’s hard to imagine a part of society that hasn’t been hit by the crisis. In this piece, journalists will learn how to use empathy to create story ideas with data.
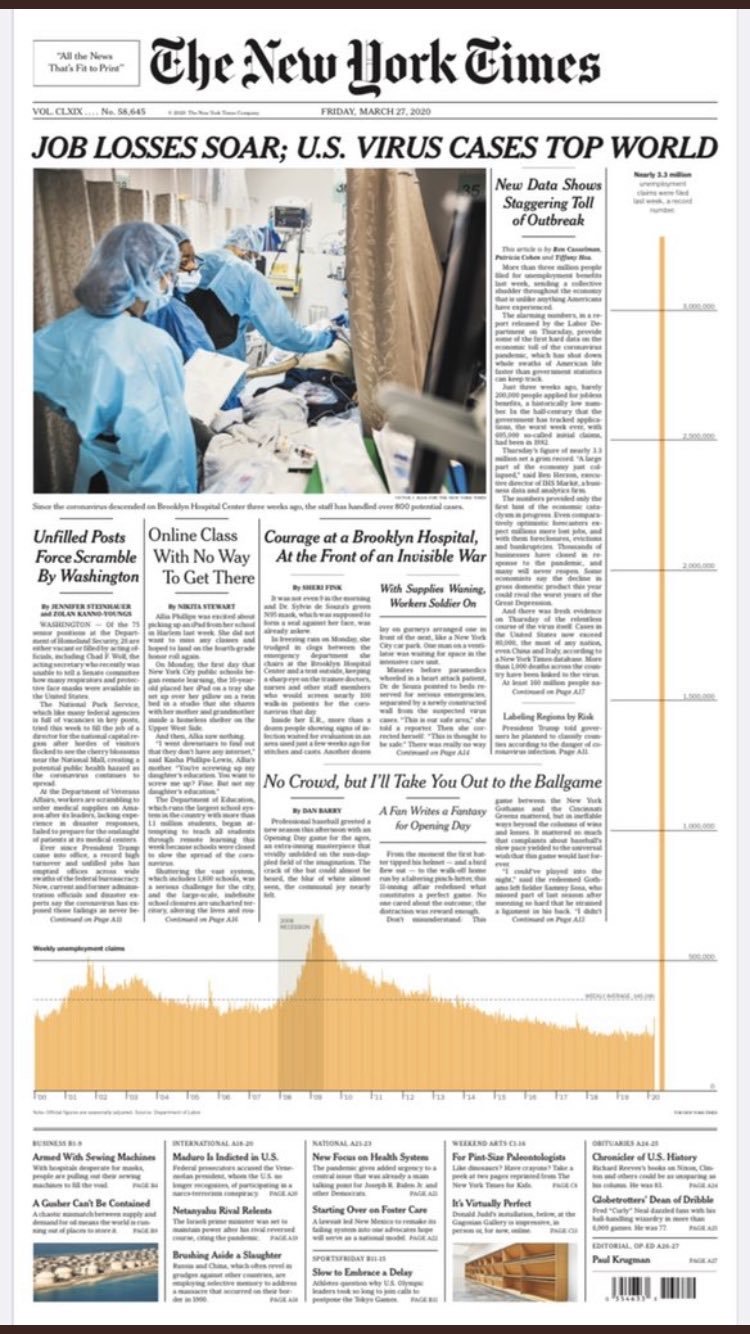
Numbers are dominating our news updates right now — not just in the daily death tolls and counts of coronavirus cases, but also in stories that attempt to establish the scale of the crisis’s impact on the world, from drops in transport and air pollution, or figures establishing how many children are having to celebrate birthdays behind closed doors, to histograms that almost shoot off the printed page.
And it’s clear that there’s a significant demand for numbers-driven analysis. Coming up with story ideas in this scenario requires resourcefulness and creativity rarely asked of journalists — but there are a number of techniques that can help.
The newness of a story lies not just in its data, but in the questions that the data leads you to ask.
Stories in the short term
In most countries, and in most fields, there is a delay between the collection of data and its publication. Data journalists often report on new data which relate to events a few months ago, or long-term trends — but during the coronavirus crisis these practices don’t always make sense. And while daily updates from health bodies and statistical authorities are eagerly awaited — they are also widely reported and picked over.
So how can you add something new to your reporting? Contextual data can be especially useful at a time like this, and boiling down an issue to its key parts can help you focus on what context is newsworthy.
The coronavirus crisis, for example, is not a deadly disease in isolation: it is a deadlier disease when our capacity to treat it is impaired. And the strategy of most governments has not been about stopping the spread of the disease, but rather slowing it to ensure that hospitals are not stretched beyond their capacity (which would result in deaths that could have been prevented).
What data is important in this context? The number of ventilators is one data point that has been particularly scrutinised; the amount of PPE is another. The number of hospitals, and their locations; the number of health staff and the number of beds — these are all parts of that capacity, and all aspects of the story that can give it something new.
Data on those allows us to establish a baseline for a country or region’s ability to handle the demands being placed on it, before adding further context on attempts to build more hospitals, add beds, bring staff out of retirement, and so on.
As we learn more about the virus, new avenues of context will open up. If ethnicity is a factor, how can we put that into context? If cramped housing is a factor, what picture can we paint of the situation regarding the state of housing? Context can be added through both time and space too: has the number of hospital beds been going up or down? Does your region or country have more or less than other places? You can combine both by looking at how the rate of change (time) compares with other areas (space).
The newness of a story lies not just in its data, but in the questions that the data leads you to ask.
If you are struggling to get data remember that a lack of data — or flawed data — is often newsworthy in its own right
If your data tells you that there aren’t as many beds in your country as there are in others, you might ask experts, charities and politicians why this is so, or what should be done about it, what is being done about it, or some other line which leads to a new story.
If you are struggling to get data, remember that a lack of data — or flawed data — is often newsworthy in its own right. A lack of data on ethnicity can lead to a story on warnings from politicians and pressure groups; a lack of data on deaths outside of hospital can lead to questions about why it’s not being counted, queries to care homes for indicative figures, and explainers on how many are really dying. Scrutinise the data being presented by politicians and health heads carefully: in the UK it has emerged that the government’s daily coronavirus briefings “repeatedly and incorrectly indicated that the UK has fewer coronavirus deaths than France, based on the numbers of deaths in hospitals”.
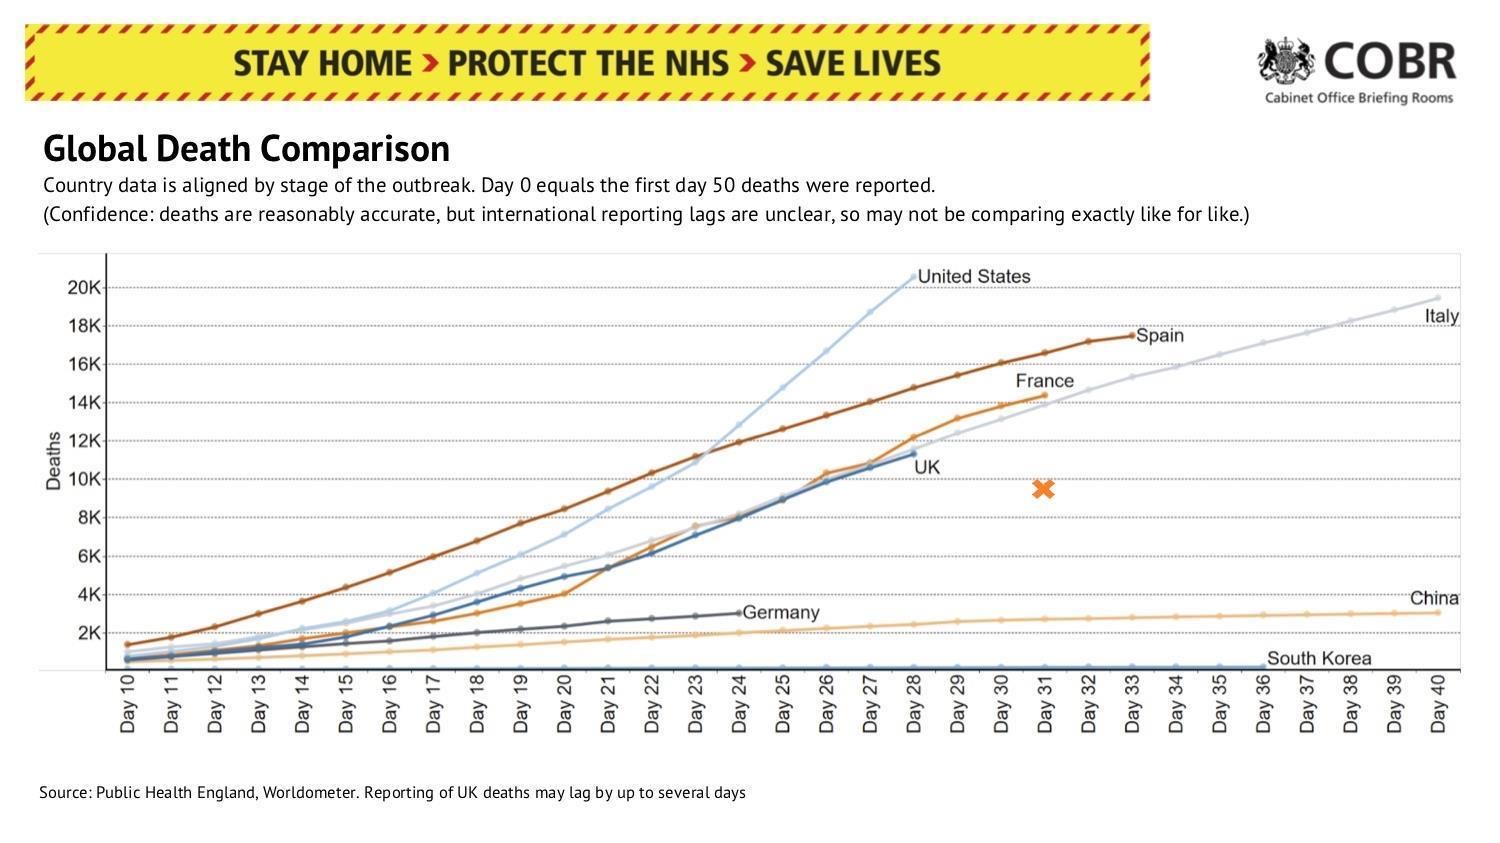
The Health Service Journal added an orange cross to this slide from the UK government to indicate the hospital covid-19 deaths for France that should have been used as a comparison with the UK’s hospital deaths.
Moving beyond health
The work to prevent deaths from coronavirus is a national effort, and you can identify three broad categories that every citizen has been placed into:
- Those infected with coronavirus
- Those being urged to stay at home to slow the spread
- Those with ‘essential’, ‘critical’ or ‘key worker’ roles allowed to travel and work
Around each, you can map a system of connections which is affected in different ways — and which affects those groups in turn. This process — which I’ve written about in detail here — involves starting with one person affected, and then moving to the people, organisations, concepts, documents and data that they lead you to.
For example, the story about who gets the disease, what symptoms they display, what treatment they require, and whether they survive, is a story that has evolved through a number of stages — age, gender, ethnicity — and from basic demographics to a reflection on divisions in our society. And it’s a story rooted in data.
A similar story can be reported about those affected indirectly: the people left without a partner, parent, child, or sibling, or the children who need to be looked after — the patterns that can be seen in their experiences might highlight systemic failures or successes; the variation will highlight the inequities.
Essential workers present a second series of interconnected systems to consider: health workers and care workers may be the front line, but they require managers to coordinate resources; supply chains to provide those resources; cleaners and other workers to maintain facilities; teachers and childcare to look after their children; transport to get them to and from the hospital; supermarkets to keep them fed; police to maintain order; and, yes, journalists to keep them informed, shine a spotlight on their experiences and concerns, and scrutinise those in power for the decisions that can be the difference between a hospital operating within capacity — or being overwhelmed.
Even at this level, we are touching on education, social care, transport, the media, politics, and the food supply — any of which can be mapped and explored for data sources.
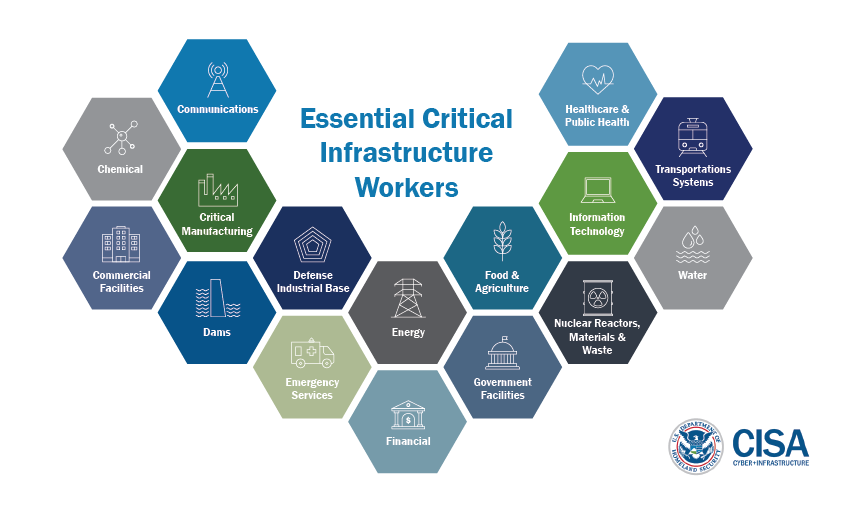
It is worth looking at official definitions of these workers to find other roles you may not have considered. Burial staff and financial services, for example, are included in the UK list, while the US list mentions dams and nuclear reactors and waste.
The final level is everyone else, and here is where the knock-on effects multiply. We can look at:
- Sectors that have had to close entirely (restaurants, tourism, beauty and sport, for example)
- Sectors that have had to adapt, largely to online delivery (education, religious organisations and some events businesses, for example)
- Sectors that have had to reduce operations (taxis, dentists, fuel and energy providers, office supplies, automotive services, or legal services for example)
- Sectors that have had to increase operations (home delivery-based retail, YouTube fitness and yoga videos, or plain opportunists, for example)
Some sectors will fall into more than one category, of course — and finding data will tell us just how much, where, when and how this is happening.
Remember that many there are many invisible industries behind the more visible ones. Restaurants, for example, rely on food suppliers, who in turn rely on farms, who in turn rely on agricultural workers. They use electricity, and fuel, hire cleaners, and buy advertising. Mapping these systems can lead you to industries — and data — you might not have thought of.
Then there are the parts of society that are invisible in other ways. The black economy, for example, is also affected: drug running has been interrupted, prices are affected and drug dealers are adapting, while sex workers are putting themselves at risk to maintain an income. More broadly, those reliant on cash-in-hand work are unable to be furloughed. And there is the unpaid work of care and domestic labour.
As physical movement is replaced with virtual movement, we leave data trails in different ways.
Changing rules, changing behaviour
As the rules change, so human behaviour changes too. Curious anecdotes — such as the driver doing 150mph on a motorway — can be the spur to find out just how unusual that behaviour is. You can ask the relevant bodies (police forces in this case) for data about that behaviour right now, but you can also make a note to dig into data on broader categories of incidents (e.g. traffic offences) when it is publicly released. And in the meantime, you can look for historical data to put that story into context.
Questions such as “What do people do when they aren’t allowed to get a haircut?” can lead you to other stories, too. Google Trends can be particularly useful for some of these — not just how many more people are searching in your area for things like “How to dye hair” but related breakout queries like “How to get hair dye out of clothes”.

If you have access to social media monitoring services like Dataminr or Crowdtangle — or are willing to scrape a sample of updates from social media sites — then you can monitor changing patterns in what people talk about, too. Brandwatch, for example, analysed social media chatter and found that “a peak in news mentions of stockpiling came just before a spike in social mentions of … things being out of stock.”
The tricky thing with scraping chatter, however, is distinguishing between talk about something, and talk that reflects actual behaviour. Brandwatch’s analysis of chatter, then, is complemented by scraping of online retailers which shows when “out of stock” listings peaked.
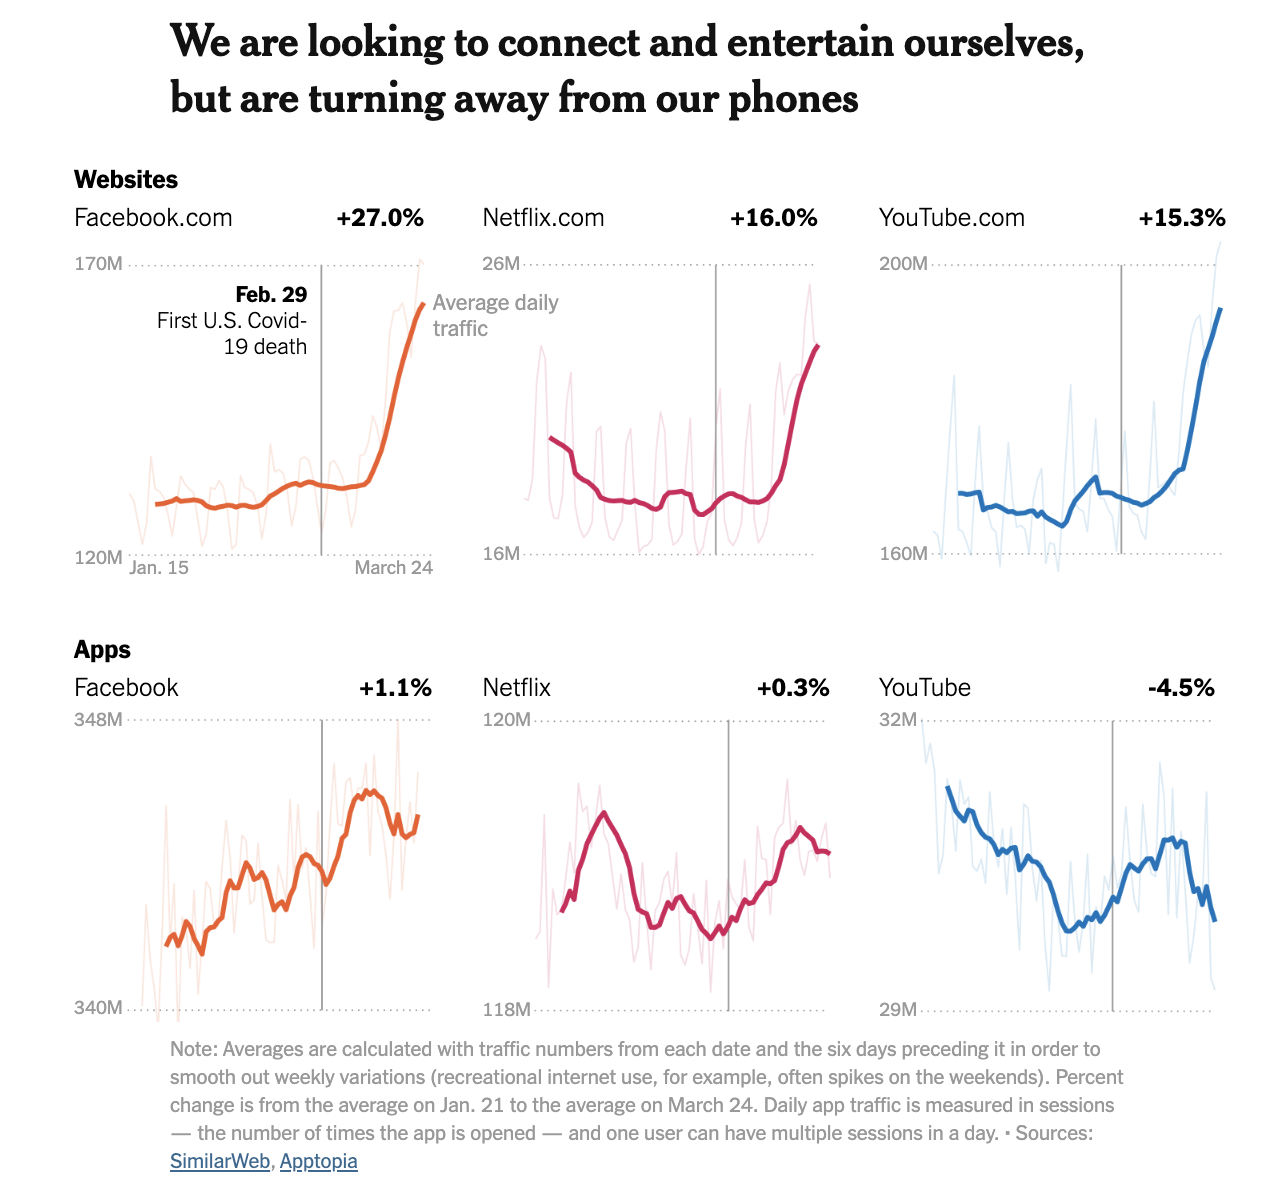
As physical movement is replaced with virtual movement, we leave data trails in different ways. Many app developers and website owners may be able to provide insights into their users’ behaviour, whether those are apps specifically developed for the current situation, or apps that can show how user behaviour has changed since before a lockdown. The New York Times’s “The Virus Changed the Way We Internet” is one of the most comprehensive examples.
Apps which monitor movements — such as those for fitness or travel — may be obvious candidates, but don’t overlook apps that might shed a light on behaviour such as home working, cooking and the availability of ingredients (e.g. recipe apps), and even crime. Don’t forget to look at apps and online services used by businesses and authorities, too, such as managing logistics or reporting problems, or the companies providing third-party services to app companies: Reuters’s article about changing travel habits, for example, was based on data from a mobile analytics company. The content that we consume on YouTube and other platforms, and the bestsellers on major retailer websites can also be quantified (often through scraping) and analysed. The key is to identify the items or terms that relate to the topic you’re interested in.
It’s important to remember that ‘data’ does not mean ‘spreadsheets’, or even ‘numbers’. Data is any structured information.
Thinking creatively about data
It’s important to remember that ‘data’ does not mean ‘spreadsheets’, or even ‘numbers’. Data is any structured information: it might be web pages or documents that follow a template, or social media updates that can be quantified in some way, or events. It also does not mean ‘statistics’. Statistics – from the same root as the word ‘state’ – are often provided by public authorities. But we can also source data from private organisations, too. Understanding this — and being able to spot structured information and the opportunities that it throws up — is central to seeing story leads and ideas you might otherwise miss.
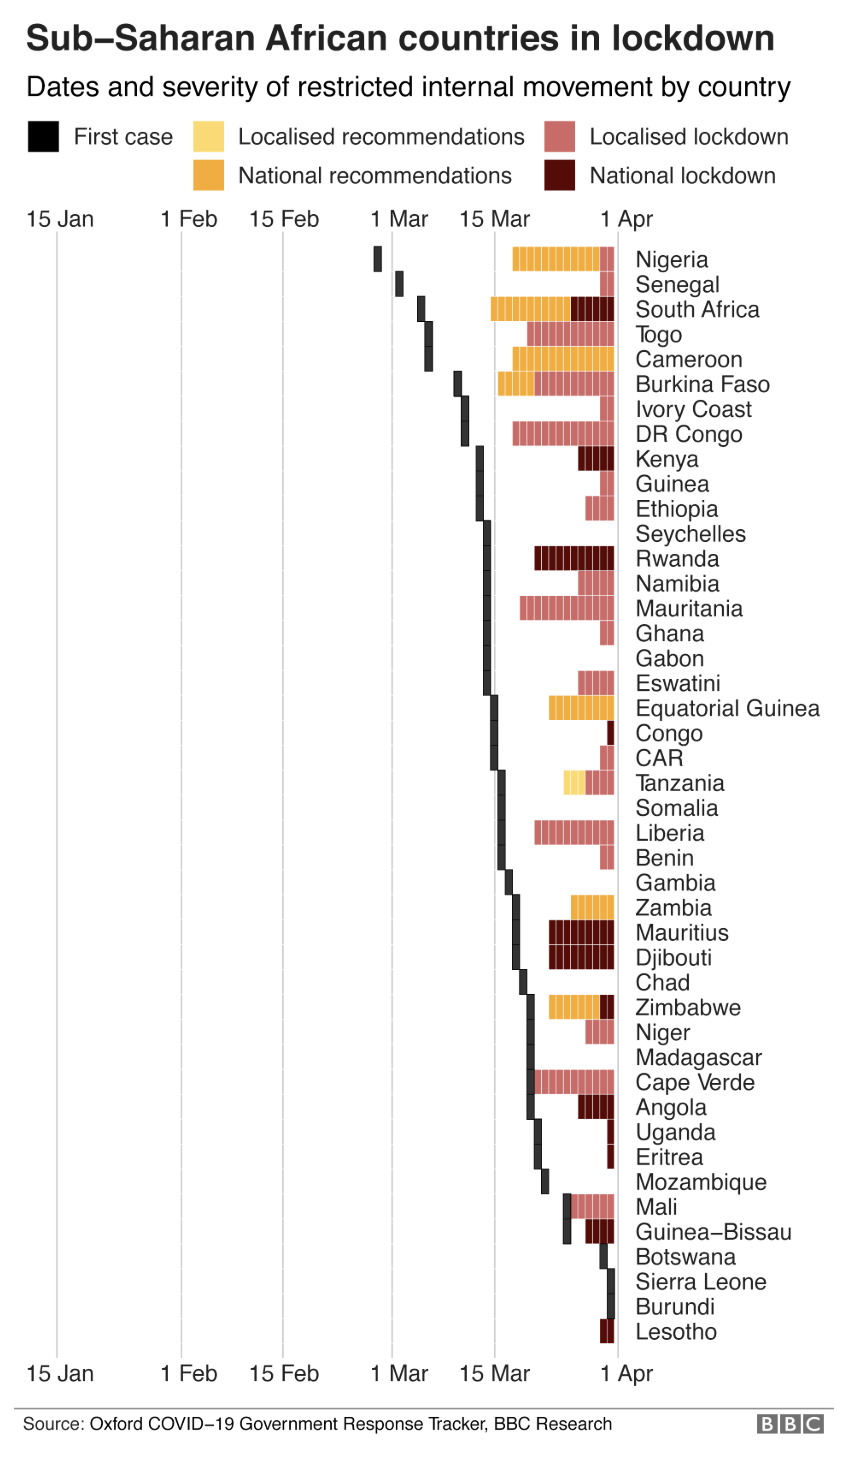
Sometimes it means creating structured data yourself through compilation and classification. See, for example, how the BBC turn the times and dates of events into charts that allow the reader to compare how different countries reacted to the pandemic.
It’s also useful to think about proxy data: that is, data which acts as a proxy for the thing you are looking for. Air pollution data, for example, can be a proxy for transport activity; energy consumption data can be a proxy for economic activity; waste collection data is a proxy for people moving away or working elsewhere. A spike in people dying at home can raise questions about what that indicates. Social media chatter and search trends are regularly used as proxies for behaviour, too.
Supply and demand are useful factors to consider when it comes to both changing behaviour and potential proxy indicators: high demand and/or low supply drives prices up, and drives knock-on demand for related products: whether that’s a lack of hairdressers leading to increased demand for hair clippers; or how demand for ventilators has led to a shortage in related drugs and forced some doctors to use “unfamiliar alternative drugs [or those] with greater side effects”.
And if you are collecting data yourself, simply sharing the data can be part of your journalistic output: The LA Times and The New York Times are just two organisations that have shared the data that they are compiling.
Looking back
There is an important exception to the focus on new data: historical data can also be given a new lease of life when it puts what is happening now into context. The Spanish Flu, for example, is not a story that readers are normally interested in reading about — but that history has suddenly become very topical.
And modern pandemics like HIV/AIDS and Ebola also become important in helping us put the current pandemic, and the actions being taken (or not), into context — just remember to avoid 3D and treating current coronavirus death counts as comparable to the final death counts of previous pandemics.
And it’s not just pandemics themselves. Historical data can also be used to shed a light on questions regarding our near future, like “Will the coronavirus lockdown lead to a baby boom?” or what happens when unemployment rises or pollution falls.
It can also provide context for current changes: this BBC data unit story on GPs’ shift to online and telephone appointments drew on data showing just how rare the practice was before the lockdown.
Reporters can look at news from other countries to identify data leads they can pursue in their own country.
Interactivity as a data angle
Another way you can use data to provide a fresh angle on a story is by using it for interactivity. The Washington Post’s coronavirus simulator, for example, has broken traffic records not because it includes new data, but because they have used data to drive an interactivity which is innovative, different — and useful.
Reuters’s “Breaking the wave” and the Economist’s “Tracking COVID-19 excess deaths across countries” take existing data and create a new way of looking at it.
It may be, then, that your fresh angle on coronavirus is simply a new way of presenting the information or helping users to engage with it. And new initiatives — from lifting lockdown to antibody testing to vaccines — present new opportunities for explanations which allow users to explore the complexities of factors such as false positives, the reproductive value and viral overload.
Interactivity is just one way that you can set your own reporting apart from others; clear visualisation, strong case studies and expert interviewees are just some of the others, so be prepared to adapt your reporting as you inevitably find others publishing stories in similar areas.
Looking ahead, planning ahead
One of the notable features of the coronavirus story is that it is at different stages in different countries. Countries where the first cases of the pandemic appeared are weeks ahead of countries where it appeared later, and different countries are taking different steps at different times.
Reporters can look at news from other countries to identify data leads they can pursue in their own country. When other countries began to release their prisoners, for example, it prompted journalists to dig into data on their own prison populations: how many might be eligible for early release, or that belonged to vulnerable groups.
As well as looking ahead we can also plan ahead: most data about the lockdown period itself will only emerge months after it is coming to an end — potentially, even, as new lockdowns are announced. So while reading anecdotal reports and single data points about crime, transport, business and welfare, bear in mind that there may well be publication already scheduled for full comparable data on those topics in the coming months that journalists should be planning for.
When that data is published expect to see a number of stories looking back at the impact the lockdown had on each aspect of life the data relates to, which “new data reveals”. You can prepare for this by looking at previous releases, compiling historical data and understanding what you will need to do to analyse the new data when it is released. That will help you turn around those stories more quickly. If you can code you can also write scripts to perform the data analysis as soon as it is released. And if there was ever a good time to learn to code, well, that time is now.
For more on COVID-19 reporting, check out:

- Data visualisation by hand: drawing data for your next story
- A data journalists guide to building a hypothesis
- Making numbers louder: telling stories with sound
- Conflict reporting with data
- The promise of WikiData as a data source for journalists
- Harnessing Wikipedia's superpowers for journalists
- Own your newsfeed, own your data
- Privacy guide for data journalists


Reporting beyond the case numbers: How to brainstorm COVID-19 data story ideas - Covering the societal impact of a pandemic with data
15 min (1) - Click to comment