Reporters give me a sceptical look when I tell them that it is possible to apply data analysis to stories that don’t require months of their time.
Too many reporters and editors equate data journalism with big, investigative projects, which is not surprising since that is where the field is most prominent and gets used the most.
But there are huge benefits to be gained from applying a little data to those quicker-turnaround stories, too, and it can be done on almost any beat or topic area while still meeting tough deadlines and keeping copy flowing to your editors.
Getting started with applying data techniques to your day-to-day workflows requires a little upfront investment -- including at least some basic data training -- but you certainly don’t need to be a veteran data journalist to pull this off for short-term enterprise stories, follow-ups to breaking news stories, and maybe even a daily story. In this Long Read, I’ll walk you through some ways to build data analysis into your everyday work and show you how some of my Star Tribune colleagues are doing so in practice.
Following the money is always a good data-driven option, regardless of your beat.
Mindset
I’m a big believer in the power of a “data state of mind” and being able to navigate a spreadsheet. Thinking about data as a source, instead of as something special or different, paired with some basic Excel training, will get you off the ground.
Let’s look at an example.
Star Tribune education reporter Faiza Mahamud wanted to do a story about the lack of diversity among Minnesota’s elementary and secondary school teachers. A state report showed that only 5% of teachers were people of colour, compared to 34% of their students.
Those two numbers were enough to indicate there was a story worth pursuing, but she had other questions. What schools had the greatest gap between the diversity of teachers and diversity of students? Were there any that had made progress in closing that gap in recent years? And what schools should she visit for interviews and photos? She could have made calls to education leaders in the state to try to find answers. But she had just learned how to use spreadsheets and she suspected data could help.
Two fairly basic and easily available datasets from the state teacher licensing board and the state department of education, identifying the racial breakdowns of teachers and students, gave her the answers to all of those questions and helped her publish a story shining a light on the lack of teacher diversity.

Finding the targets
Certainly, not every story is going to need data, nor will there be time to use data on everything. So the first hurdle is picking your targets. Enterprise stories, like the one Faiza produced, are a natural target. But what if you don’t have an idea in mind?
I frequently sit down with beat reporters in my newsroom and ask them a couple of simple questions: “What topics keep coming up over and over on your beat?” and “What are people talking about that you’d like to prove is true or not true?” After they answer my questions, I tell them: “There’s your story.”
Emma Nelson, a city government reporter, had been hearing that the city of St. Paul had been condemning a lot of properties simply because owners had failed to pay water bills. She wondered if it was true.
The city didn’t track this data, but she found out that they could provide her with a spreadsheet with dates and addresses where condemnation letters had been sent. However, she had to read hundreds of PDF copies of the actual letters to find the reason for condemnation, and manually add that to the spreadsheet. She gradually worked on this story, in between other assignments, over a few months. Once finished, the analysis was pretty simple.
Editors want you to meet with those important human sources, so why not take some time to ‘have a coffee’ with your data sources, too?
Her story prompted the city to approve a policy giving city residents more time to appeal water bills and shut-offs, and to start tracking this themselves.
The other place to look for a story is when you’re spending long stretches of time covering one issue. Editors are demanding that you stay on top of the breaking news, but also generate enterprise stories. This is always a good opportunity to see if data can help get you a better story.
Mila Koumpilova found herself in this situation as the higher education reporter, covering the University of Minnesota’s effort to replace its retiring president. This year-long process yielded story after story, but she saw a data opportunity by following the money. The university had hired a search firm to find candidates for the job. She wondered how much they were being paid. And how much did the university spend for search firms to help fill other jobs? With the data, she was able to write an eye-opening story about how extensively the university used search firms. Side note: following the money is always a good data-driven option, regardless of your beat.
Meet your data
You will also be more likely to find stories if you know what data sources are available. When you start a new beat, usually your first task is to find out who the important people are -- the ones you need to be talking to on a regular basis. I tell reporters to expand that process and also find the important datasets you should be “talking to.”
I suggest they get a copy of the important datasets to not only learn the process of obtaining it, but also to tinker around with it in spare moments. Editors want you to meet with those important human sources, so why not take some time to ‘have a coffee’ with your data sources, too?
Being familiar with a dataset will make it far more likely that you can put it to use in the future. I’ve had many situations where a reporter or editor came to me to discuss an upcoming story and because of past experience with a dataset, I could quickly envision what would be possible.
Sometimes the data you want just isn’t available. That’s when you can really get a special story -- by building it yourself.
That also makes it more possible to add data analysis into a daily or very quick-turn story. That’s what sports reporter Ben Goessling did about three weeks into the 2019 American football season.
He knew of a website where he could download numerous years of team statistics that included a key metric: how often teams used a run play versus a passing play. He wanted to put the Minnesota Vikings 2019 season performance into historical context. More than 60% of the Vikings’ plays had relied on running, which even a moderately knowledgeable Vikings fan knew was atypical.
Ben downloaded about 10 years’ worth of team statistics, then added a column identifying how each team fared in the playoffs that year. His story featured a quick analysis that showed the most successful teams had a more balanced offence, running the ball 40 to 45% of the time. I should note that he did all this in less than a week, while also writing daily stories and doing a podcast. If you read the story, you’ll see that his analysis resulted in a couple of sentences and a graphic, but it added support to the rest of his reporting.
Recurring datasets
When you go hunting for datasets, also find out when they are regularly updated. You’ll usually find some that might be newsworthy when the new data is released.
In those cases, you can count on that data to yield annual stories and sometimes even produce unexpected stories you hadn’t thought about.
In these situations, the key is planning ahead. It helps to have a rough idea of what story you think the data can help you tell, or at least have some questions you are hoping to answer. You don’t want to dive into a dataset without a game plan.
Business reporter Christopher Snowbeck routinely mines Medicare cost and enrollment data that comes out each year to bolster his reporting on how that business is changing and what senior citizens can expect when they are shopping for plans. Before the data arrives, he already has questions he wants to ask the data based on what he’s hearing from his sources. Often his analysis yields a sentence or two that supplements his traditional reporting, or confirms what he’s heard from others.
Education reporter Erin Golden mines data on graduation rates and school test scores every year to keep readers up to speed with student achievement. There are always the basic stories around whether rates improved from previous years or not. But her familiarity with the data, from using it every year, also helps in other ways.
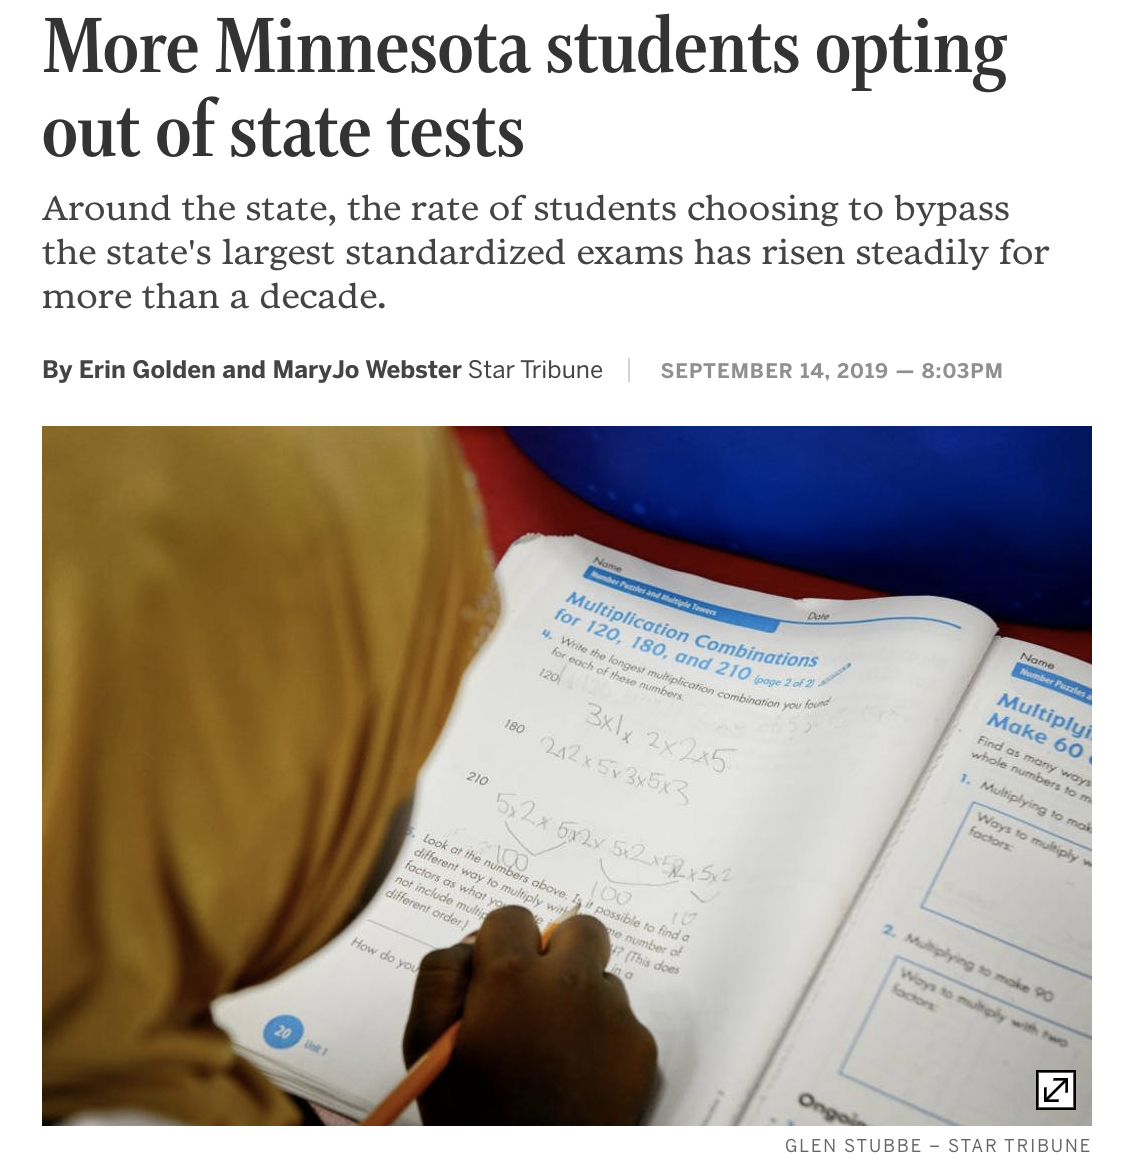
In 2019, the state education department put out a press release outlining the school test scores that attempted to put a positive spin on results. She and I looked at the data and saw nothing positive about it. The data showed flat or even declining test scores almost everywhere, and among every group.
Without a prior understanding of the data, another reporter might have written a very different story based on that press release. Sometimes these data dumps can bring surprises, too, which aren't in those press releases. From that same dataset, Erin and I found another story: the increasing number of schoolchildren opting out of taking the standardised tests.
Breaking news
Reporters who have general assignment jobs, without a defined topic area, struggle with my recommendation to find datasets pertinent to their beats. But there are a lot of datasets that can be useful in breaking news situations that these reporters should have at the ready. Imagine being that reporter who stuns the editor with an impressive story putting a news event in context just a few days later.
I was in that situation in 2007 when a major bridge collapsed into the Mississippi River in Minneapolis, killing 13 people and injuring dozens of others. I was working at the St. Paul Pioneer Press at the time, and had previously dabbled with the federal bridge inspection database. I knew where to get that data and that it would allow us to look at which other bridges in Minnesota were considered deficient and in need of repairs or replacement. We published that story four days after the bridge collapse.
Look for datasets on vehicle crashes, plane crashes, building fires, workplace deaths, or gas line explosions. At the same time, get to know what agencies do inspections that are designed to prevent these catastrophes and see what’s in their data.
The key is keeping your analysis focused, with a manageable scope.
Get some basic data at the ready so you can answer questions like, “Have there been more murders in our city this year than any year in the past?” Have a good understanding of census demographic data to know when a city or county in your area is on the verge of becoming majority-minority or passing some other important benchmark.
There might also be data opportunities around big events in your area. Is your city hosting a festival or a major sporting or political event? For these, the data opportunities might arise after the event. Is there government spending involved that you could track? Is there data showing how much overtime law enforcement incurred to provide security for the event?
Also think about whether there are any important anniversaries coming up. Ten years after that bridge collapse, I helped a fellow Star Tribune reporter use data to look at whether Minnesota had lived up to its promise of fixing all the other deficient bridges. On the anniversary of a horrific injury to a high school hockey player, sports reporter David La Vaque, with some help from data journalist Alan Palazzolo, analysed penalty data to assess whether rule changes after that injury had changed the game.
Build it yourself
Sometimes the data you want just isn’t available. That’s when you can really get a special story -- by building it yourself.
Many news organisations in the United States, including my own, set out a few years ago to count how many people had been killed in encounters with police. We all discovered that law enforcement agencies weren’t doing a good job tracking this. So we did it ourselves.
My newspaper published our version of that dataset nearly four years ago, and we decided to keep it updated. Each time there is a new death, we add a record. Every few months, we take some time to review news stories from throughout Minnesota and the state’s death certificate database to find any we missed. Now when a new incident happens, our breaking news team has data at the ready to show readers how many similar incidents have happened this year or in this particular law enforcement jurisdiction.
Take this idea of tracking something and think about whether there are other places you could apply it. Are there city council decisions that you want to track in a way that the city doesn’t? Would it be worth tracking hate crimes and documenting more detail about each one than the law enforcement agency does?
A few years ago, sports reporter Marcus Fuller wanted to quantify something he noticed while covering college men’s basketball. He saw that there weren’t very many black head coaches, and he was certain the number had declined over time. Marcus, along with some help from an intern, ploughed through college websites and media guides and called athletic directors to build a simple spreadsheet of coaches at each of the top tier teams, going back in time. The data proved his theory and provided the backbone to an important story.
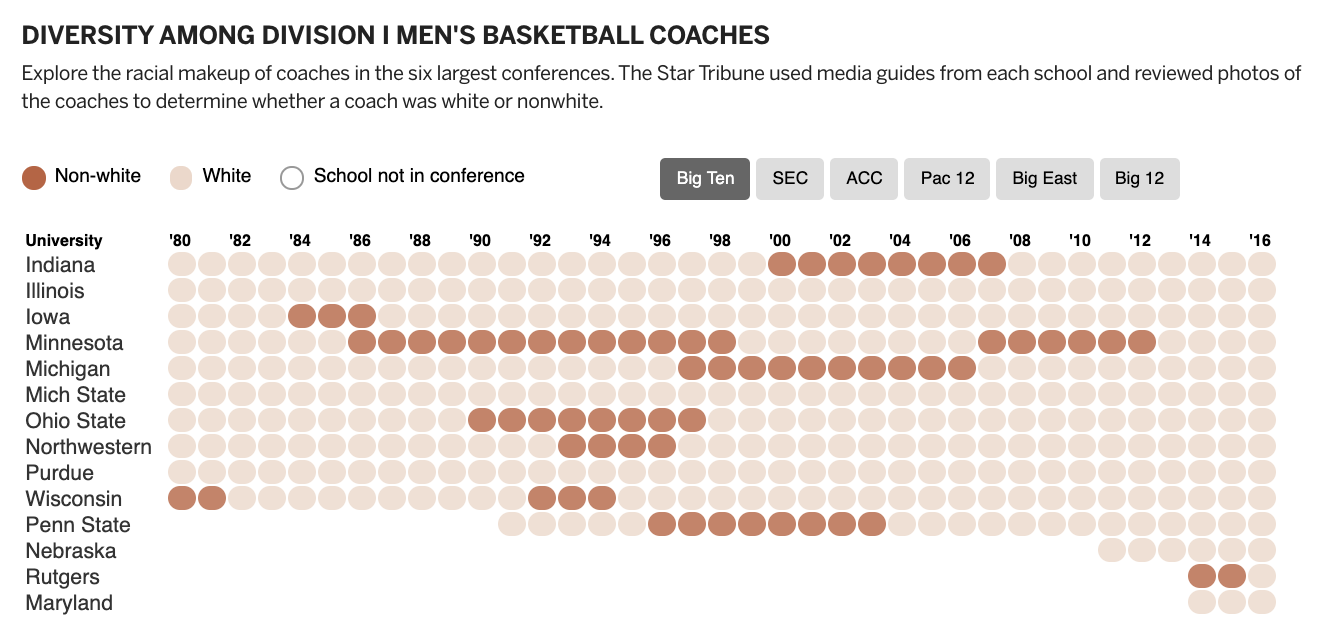
In the above chart, each year represents the year the season began. Schools in the Big 8, which became the Big 12 in 1996, are included under the Big 12.
Keeping it manageable
Now that I’ve planted a ton of ideas in your head, I’m sure you’re wondering, “How do I actually pull it off, in between all my other responsibilities?”
Yes, that is the challenge.
The key is keeping your analysis focused, with a manageable scope. How big that is will be different for each story and dependent on your data skills. If you have someone to help you in your newsroom, you can spread your wings a little more. If you are really new to working with data, or if you don’t have someone to help you, you’ll want to keep it very tight and try to pick datasets that are simple.
A dataset that has nine relational tables, loaded with codes that need to be translated using lookup tables, will probably be too much for a quick-turn story.
Also, think about the quantity of data that you are working with. Do you need 20 years’ worth of data to tell the story you want? Does it need to include every school in the state? Sometimes less data is sufficient, making it less time-consuming, too.
You want to be sure you thoroughly understand your data and that you’ve done the analysis correctly, but without spending too much time fishing for things you don’t need.
Keep in mind that you might not need to do data cleanup or standardisation on every field in the dataset. If it’s a field you aren’t going to use, just leave it alone.
Start with just a few questions that you want to answer, as Faiza Mahamud did for her story on teacher diversity. Try to stick to those questions and not let yourself veer off on tangents.
It might sound like I’m telling you to cut corners, but in data work, there are often things that can be trimmed without sacrificing the quality of the work. You want to be sure you thoroughly understand your data and that you’ve done the analysis correctly, but without spending too much time fishing for things you don’t need.
Here’s where a good editor or colleague can come in handy. This person doesn’t necessarily need to have data skills. Show her your findings as you proceed. Her reaction will help you figure out when you’ve hit gold, or where there might be lingering questions. She will help you see if something might be too good to be true, or where your analysis doesn’t jibe with what you’ve heard from sources. She can also help you steer clear of tangents, and keep you energised.
A data diary is your friend
You will also probably need to pick away at your data analysis slowly, over an extended period of time, while working on other things. Once you have some findings, perhaps your editor will be able to free you up a little to do the rest of the reporting and crank out the story.
Make your life easier by keeping a data diary. This could be a text document or in a paper notebook. If you are using a coding language like R or Python, your documentation could be annotated right in with your code.
Your diary will need to include basics like where and when you got the data, the name and contact information of the person/agency who provided it, and what is or isn’t in the data. Then, as you go through, document each step. Make a note about a field you cleaned up. Put down questions that pop into your head.
A key to being successful using data for daily or quick-turn enterprise will be having a supportive editor.
At the end of each session working with your data, write yourself a to-do list for the next time. All of these steps will make it easier for you to pop in and out of the data as efficiently as possible. You don’t want to waste a ton of time next week trying to figure out what you did last week.
You also need to carve out time in your calendar to work on your data. I find it helps to have a very specific to-do list that you can turn to when you have a free block of time, even if it’s just 15 minutes. Instead of writing down something vague like “work on my data,” break it into pieces. For example, a good to-do list might include: “call agency source and ask why field X is blank” or “clean up the date field” or “create a Pivot Table looking for X.” Keep each item very simple and limit your tasks to things that can be done in a limited period of time.
Another helpful trick: Use the first 15 minutes of your day for this work, before jumping into something else. Set a timer, if necessary, to remind you to jump back to your daily work.
Working with your editors
A key to being successful using data for daily or quick-turn enterprise will be having a supportive editor. Ideally, this person would be willing and able to let you slide on covering a mundane council meeting or writing a simple daily to give you spare time for something a little more ambitious. At the same time, though, you need to prove to them that you will deliver.
I’ve seen a lot of editors who are reluctant to free up reporters because they’ve been burned in the past by reporters who didn’t deliver. So a simple rule of thumb: Don’t promise more than you can deliver. Start small. Save your big ideas for later, after you’ve proven yourself.
Involve your editor in your story as much as you can. Encourage her to review your data findings. Get her excited about how the data will make for a better story. This is especially important if your editor isn’t data-savvy.
Unexpected benefits
Using data on a regular basis for stories has a lot of perks beyond just the good stories that it helps you produce.
Data can be great at helping you find the people who will bring your trend story to life, or the places you need to go for interviews and photos. We’ve used election and census data to find rural Minnesota communities that had just the right mix of voting trends and demographics that we were looking for. Health reporter Glenn Howatt used data on school vaccination rates to pinpoint which schools he should talk to for his story about places lacking herd immunity for measles.
Even some simple data can help you go beyond the press release that a government agency has put out, giving more context to a daily story.
Getting data helps you dive deeper into your beat or whatever topic you are writing about. You see the details, plus you can see the big picture.
Possibly the best perk, though, is that the human sources on your beat will come to know you as that person who is going to be fair and thorough, who doesn’t settle for one good quote. I’ve seen numerous reporters command more respect just by tapping into data on a regular basis. You can, too.

- Data visualisation by hand: drawing data for your next story
- A data journalists guide to building a hypothesis
- Making numbers louder: telling stories with sound
- Conflict reporting with data
- The promise of WikiData as a data source for journalists
- Harnessing Wikipedia's superpowers for journalists
- Own your newsfeed, own your data
- Privacy guide for data journalists

Bringing the power of data to deadline stories - Why data journalism isn't just for investigations and in-depth reporting
18 min Click to comment