Work Practices
Type of data journalism
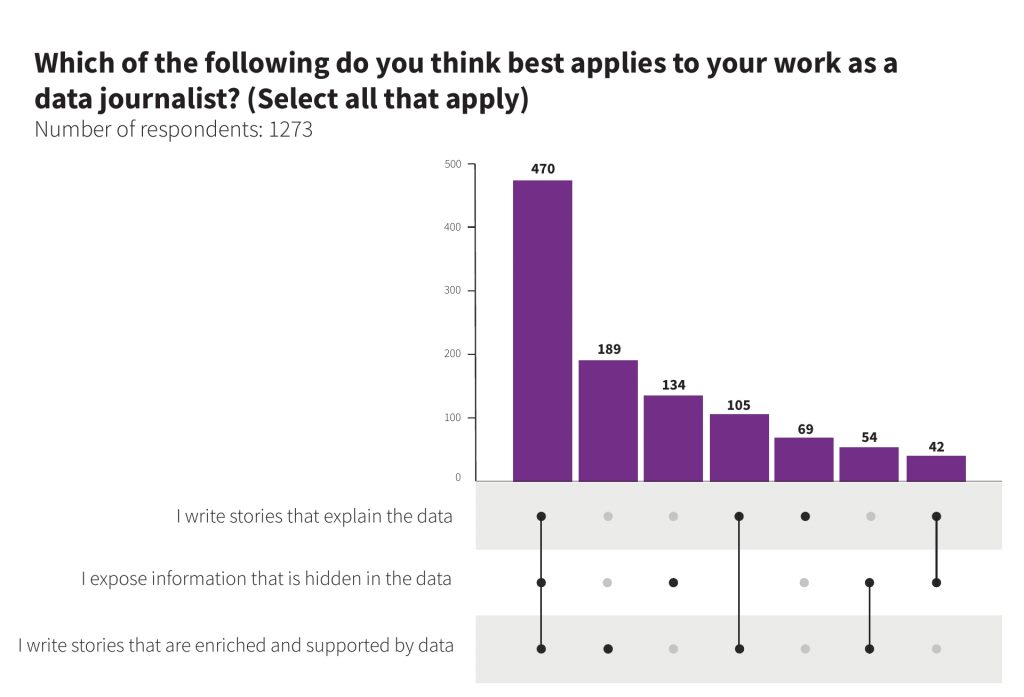
In 2017, Simon Rogers, Jonathan Schwabish, and Danielle Bowers published a report on the state of the field1 of data journalism. The findings showed data journalism outputs generally fell into three categories: investigative journalism, stories that explain data, and stories that are enriched by data. Among those, we found that the most practised type of data journalism uses data to enrich the story (64%). As the authors of the 2017 Google News Lab report describe it, this type of data journalism is made of stories that do not rely on the data itself to exist but use data to support and strengthen their argument. Nonetheless, over half of respondents still participate in both investigative data journalism (e.g. Pandora Papers by ICIJ) and publishing data explainer articles.
The chart above hints that on average each person has selected two options from the answers list. Our aim was to determine how people combine the different forms of data journalism story types. How common is it to work on all three types of data stories or specialise in one type? Below we break down the counts for each possible combination. By far the most common was the selection of all three choices (37%), showing that many data journalists produce stories that use data in a variety of ways.
Work tasks
We asked data journalists what data-related tasks they carry out alongside traditional reporting activities. Most data journalists analyse data in their work (80%), but data gathering (65%), data visualisation (62%), and data cleaning (54%) are relatively common. Programming for work is performed by over a quarter (29%) of data journalists. Designing web pages (18%) and developing data-driven applications (12%) remain niche tasks.
As for gender, we see less women involved in programming (22%) compared to their male counterparts (33%). However, 57% of all non-binary/genderqueer respondents indicated they code/programme for work.
Another interesting data point the survey captured focused on examining the salaries of data journalists. We saw a positive correlation between carrying out more tasks and earning more money, as our last chart demonstrates. The best-paid jobs involve highly technical skills like programming and developing data-driven applications. Simply put, the more technical skills data journalists have and use in their day-to-day work, the higher the salary.
Scope
What scope of media did our survey results represent? The most common coverage scope is national news outlets (51%), followed by international news outlets (42%). Considering our definition of local news was quite broad, including both city, municipality, regional, and state level, it is quite remarkable to see such a small level of engagement in local news (30%). This could be an indication that data journalism may be less used in small, local newsrooms, or that the production of data-driven local news may be limited by the availability of reliable local data.
Beat
Similar to Heravi and Lorenz’s survey2, or the more recent Muck Rack 2021 State of Journalism survey3, we found that Politics tops the type of beat data journalists cover (52%). This is followed by the Environment (44%). While journalists may have taken a stronger interest in environmental issues due to record-breaking temperatures and climate change-driven disasters in recent years, it is interesting to note it came ahead of the Economy (42%) and Business (33%), both traditionally data-heavy beats.
Is data journalism domain-specific? The distribution is long-tailed: the most common choice is to work on one specific beat, but many still work across several, with some selecting near to all choices.
Medium
Altogether, 73% of respondents indicated they work for an online platform, making digital outlets the most popular medium types for data journalists. One in three say their data journalism stories are shared on social media. Meanwhile, a quarter of respondents say their data journalism stories are published in print newspapers.
Data used
By far the most used type of data by data journalists is public official governmental data (73%). About a fifth of the time, FOI data is used (21%). On average, data journalists employed in news companies or organisations work with more types of data compared to other occupation types. Where they stand out the most, respective to the other categories, is scraped data. Instead, data that is easily accessible, like government census data, public governmental data or open-access data seems to be the preferred option for students. The category most noticeably missing by this learning group is FOI data, which instead peaks with the most professional roles, from full-time freelancing to editors and employees.
At an individual level, data journalists who earn more showed being positively correlated with working with more data types, particularly FOI, survey, scraped, and government census data.
Instead, we found that company size does not exhibit any particular pattern in terms of the number of selections and preferences, with the only noticeable element being that very small companies (1 to 9 individuals), tend to have worked with fewer data types in the past year.
Lastly, do we see big differences across countries? We looked at the top 20 countries by survey respondents and found that the number of data types used varies substantially. For example, Sweden and Turkey both had 15 respondents. However, our survey revealed Swedish data journalists work with a large number of data types — almost double to their Turkish counterparts.
One data type that varies substantially across countries is FOI data, which may be a reflection of differing FOI legislation from country to country. Russian data journalists ranked at the top of the survey citing usage of scraped data, social media, and public governmental data, putting them in second place for the number of data types used.
Finally, we kept an eye out for government census data in the US, as August 12th, 2021 saw the release of redistricting data from the 2020 US Census. We saw that 66% worked with census data. While this figure is impressive, and is over the average globally, it is not particularly higher than that of Canada, which will release its 2021 Census data in early 2022.
Dedicated data unit
We found that 22% of data journalists work in a dedicated data unit, with more working in organisations that only seldom publish data-driven projects (25%). Our figure is much smaller than that of Heravi and Lorenz’s paper2, which indicated just less than half of their respondents worked in dedicated data units. We see our result as a sign of the lack of resources to employ dedicated data journalists or to formally set up a data unit within the company. We found that the larger the company, the higher the share of dedicated data units, peaking at 30% in companies with over 500 employees.
Within the dedicated data units, the vast majority is comprised of 3 to 5 individuals, followed by 1 to 2. This indicates that within most companies, you are likely to find one or few specialised data journalists, with the share slowly decreasing as we step up the data unit size. Among the largest dedicated data units, we found journalists from The Economist, The New York Times, Reuters, The Financial Times, and the BBC, a reminder that such big data units are possible in mostly well-established media organisations.
Project team size
Some data journalism projects require large teams, sometimes even across newsrooms, to see the light of day (e.g. The Pandora Papers, the largest data investigation to date). Others, instead, are the output of a single data journalist (e.g. Following the Science, by Jeff MacInnes for The Pudding). We found that the most common project team size is small. Data journalism stories are mostly produced by small teams of 2 to 5 individuals (43%). Larger teams are quite rare (7%), while a third of data journalists usually work alone (33%).
Project duration
How long does it take to complete a data journalism project? Our survey reveals around half of data journalists said they required several weeks to over a month to complete their last project (50%). Meanwhile, a fifth (21%) completed their projects in less than a week. This is a very different finding from Google News Labs’ 2017 report1, where they saw 49% delivering a project in a day or less (compared to our 8%). Although Google News Lab’s survey sample focused specifically on the US, the UK, Germany, and France, our survey showed different results, even when examining our figures by country. A difference in sampling strategies might account for the observed variations, where the Google News Labs report focused on the views of data journalists and editors working within news organisations. Nonetheless, even by filtering out freelancers, students, and educators, we still do not see many variations in the results. We interpret this as a potential indicator that time pressures for data journalists in newsrooms might have reduced over the years, although other explanations are possible. As the field matures, the desire to produce more impressive designs and more sophisticated data stories may also be a motivating factor for data journalists.
Collaborations
In the span of a year, we found that 27% of data journalists have taken part in a collaborative project. We used the framework proposed by the Centre for Cooperative Media4 to study these collaborations, organising them in six categories, defining the duration and production type of the project. Around half of respondents indicated participating in collaborations where content production was separate. This type of collaboration is described as fruitful for small news organisations trying to expand their reach or recognition. A similar figure was found for collaborations where the content was co-created. This is a resource-efficient approach and suits investigative reporting as well as other newsrooms with similar audiences. The least common selection was of projects where content, data, and resources were shared at the organisational level, such as in the case of the ICIJ for The Pandora Papers.
Regarding the collaboration duration, in all instances, the majority were one-time projects (61% altogether), although ongoing deals are not all that uncommon (39%).
The most widely perceived benefit of the collaboration was the opportunity to open up to wider audiences (57%), and the possibility to do better work than alone (53%). Data journalists also indicated the positive effect of learning from one another (46%) and filling existing skill and expertise holes within their newsrooms (44%).
On the other hand, different levels of tech expertise were considered the greatest challenge to the collaboration (44%), followed by differing newsroom cultures (42%). The cost of coordination and training, as well as the need to balance power dynamics, were not as commonly seen as challenges, although still reported by one in five data journalists.
Cited work
- Rogers, Simon, J. Schwabish, and D. Bowers. “Data journalism in 2017.” Google News Lab (2017).
- Heravi, Bahareh R., and Mirko Lorenz. “Data Journalism Practices Globally: Skills, Education, Opportunities, and Values.” Journalism and Media 1, no. 1 (2020): 26-40.
- MuckRack. “The State of Journalism 2021”.
- Stonbely, Sarah. Comparing models of collaborative journalism. Center for Cooperative Media, Montclair State University, 2017.