What is the most efficient way to communicate a large amount to a reader? We ran an experiment to find out. The results are clear: we must focus on showing whether a number matters or not, rather than making senseless ‘football field’ comparisons.
When journalists try to communicate large amounts, they have a tendency to measure area in multiples of football fields, and volume by Olympic swimming pools. For example, an Associated Press headline from 2015 informed us that “Enough water to fill 1 billion Olympic-sized swimming pools has melted off of Alaska's glaciers over the past 5 decades”. While the origin of this practice has not been researched, examples abound. A writer from the New York Times told his readers in 2002 that a farm in Uzbekistan used enough water “to fill 1,300 Olympic swimming pools”. Four decades earlier, his colleagues were already counting in football fields to describe the area of an office building (“10 football fields”). I found minimal literature on the topic, but there is no reason to believe that European journalists did not apply the same techniques as their counterparts in the United States.
The development of data visualisation in the early 21st century has retained the same trick, but with new tools. In 2012, Demonocracy -- an infographics studio specialised in economics -- tried to make sense of the public debt of the government of the United States by visualising it in $100-dollar bills.
Such approaches assume that comparing an unknown amount to one that is supposedly familiar to the reader allows the reader to interpret the unknown quantity correctly. This assumption -- which was never checked -- led to the creation of tools to speed up and multiply such comparisons. These tools intended to help readers make sense of large, unknown amounts.
We designed an experiment to test this assumption. Our results showed that people actually understand amounts much less when they are expressed as a proportion of another amount.
The experiment
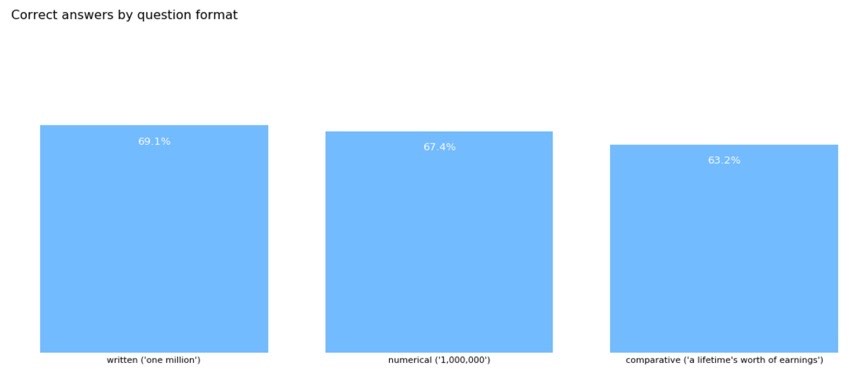
Users are given an interactive questionnaire, presented as a game called Order of Magnitude Guesser. The goal is to correctly guess the order of magnitude of eight questions of varying degrees of difficulty. The answers can be phrased in three ways: Numerical (‘€1,000,000’), written as text (‘1 million’) or relative to a daily-life item (‘the lifetime earning of an average employee’). Given the large difference between the possible choices (a factor of 10), most questions could be answered correctly using deductive reasoning while the others could be answered with only a modicum of topic-specific knowledge.
Results
The game was played about 2,000 times between 8 November 2016, and 18 January 2017, by users from 66 countries. Over 32,000 questions were answered, an average of two games by user.
On average, users found the correct answers two times out of three. Random chance would have returned the correct answer once in every three questions.
J++ 2016 study funded by openbudgets.eu.
Users performed significantly better when the answers were displayed in numerical or written formats, as opposed to a comparison. The result holds for every type of question and for every order of magnitude (large and small amounts alike).
An issue with journalists
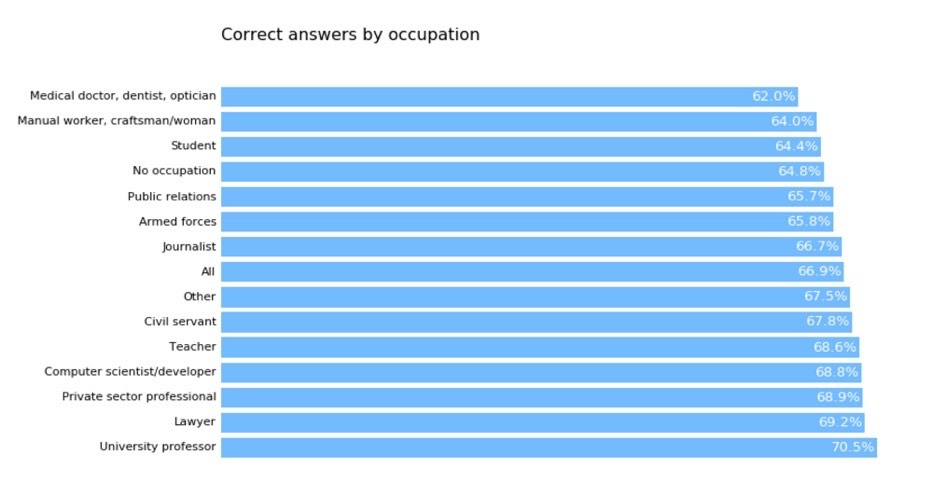
While few would argue that journalists have trouble with numbers, little experimental evidence exists to demonstrate it. Users who self-identified as journalists performed slightly less than average and users who self-identified as public relations professionals performed a full percentage point lower than average.
These results show that specific efforts must be made when conveying numerical information to journalists and PR professionals.
J++ 2016 study funded by openbudgets.eu.
How to convey large amounts
The results of the Order of Magnitude Guesser show that users performed best when they could relate the amount under consideration to something they knew (users found the right answer four out of five for items from daily life) or something they assumed to be normal.
Some questions yielded results that differed from this trend. When asked what the budget of the central government of France was, users answered wrongly six out of 10 times when presented with the numerical (€1,000,000,000,000) or written form (one trillion euros). This result, barely above random choice, is in line with other findings. However, when presented with the comparative form (twice the budget of Spain), users found the correct answer four times out of five. Given that users probably had no idea about the size of the budget of Spain, the informational value of the statement was close to nil. However, users could correctly guess that two countries they knew to be somewhat similar in size had budgets that were of the same order of magnitude. In other words, they assumed that it would be normal for two countries of similar size to have budgets that are not too far apart.
Other examples point in the same direction. Users were almost twice as likely to correctly guess the budget of the city of Berlin in the comparative format (twice the budget of Paris) than in the numerical or written formats (twenty billion euros). Again, users could guess that Berlin and Paris, two cities they knew to be somehow similar in size (two million inhabitants in Paris and 3.4 in Berlin) had budgets of the same order of magnitude.
Conversely, when users were asked to compare budgets of entities for which they had no yardstick of normalcy for, they performed worse than random chance. For instance, when asked to compare the budget of European institutions against the budget of Sweden, users found the correct answer 30 times out of 100 (random chance would have yielded a correct results 33 times out of 100). Similarly, users were completely unable to correctly guess the budget of the European Space Agency. If the comparative form had been a comparison with the budget of NASA (which is 4 times higher than ESA’s), users would have probably been able to correctly guess, because it would be normal for NASA and ESA to have budgets in the same range.

When asked to compare budgets for which they had no yardstick of normalcy for, users performed worse than random chance.
Our findings -- that users relate to normality when estimating correct amounts -- explains a lot about the choices journalists make when covering stories that involve monetary amounts.
A story begins when something out of the ordinary happens. In other words, it begins when an abnormal situation develops. A situation can only be correctly reported as abnormal if the person who reports it knows what normality is on a particular issue. This is why stories that involve a large discrepancy between what the journalist considers to be normal and the situation at hand can get a lot of coverage.
One example is the so-called CoiffeurGate (French president François Hollande’s personal hairdresser being paid €10,000 a month), where journalists could easily comprehend the difference between the price of a normal hairdresser and the amount in the story. It does not matter that normality, in this case, could not be the same for heads of state and heads of public institutions than for journalists. French presidents enjoy privileges ranging in the millions of euros per year in personal benefits during and after their presidencies. In particular, former president Sarkozy employed a full-time make-up artist for €8,000 per month. The hairdresser story became popular not because journalists correctly identified an abnormal situation, but because they used a wrong normality to reach their conclusion. They used their normality versus the French president’s, instead of the French president’s versus other French presidents’ and public officials’.

A story begins when something out of the ordinary happens.
In cases where journalists do not have a reference point for normality, certain stories are not perceived as abnormal. For example, a story in 2014 on the laundering of 20 billion euros from Russia to the United Kingdom, published by global non-profit OCCRP, received absolutely no coverage from most large British outlets. Following our theory, this can be explained by the fact that journalists have no clue about how money normally transits from Russia to London and could not identify a major story when it appeared.
This theory -- that journalists gravitate towards stories involving amounts they consider abnormal -- can be contested on several fronts.
First, many factors come into play when deciding to pursue a story or not. Self-censorship is most obvious, especially in newsrooms where clients (say, advertisers), or patrons have strong demands regarding the nature of the stories being covered. The Daily Telegraph chose not to cover the Swiss Leaks stories not because their journalists could not comprehend the abnormality of tax evasion, but because one of their clients -- HSBC -- asked them not to. Similarly, it could be argued that Le Figaro did not cover the illegal financing of French Parliamentarian Serge Dassault’s electoral campaign, not because their journalists did not understand it, but because Mr. Dassault owns the newspaper.
Another argument against our theory lies in the embodiment of a story. A story that involves well-known characters will get more coverage and receive more interest from readers than a story that does not. This argument aims to explain why the €100,000 #CoiffeurGate story -- featuring high-profile former French President Hollande --received more journalistic attention than the €20 billion Russian laundering scheme, which featured unknown characters. This argument is very weak. Indeed, the role of the journalist is precisely to find and describe characters that can carry a story. Several investigations relied on personification to make the story more enjoyable for the audience. For example, Swiss Leaks -- the 2013 investigation into how HSBC organised tax evasion from Switzerland -- used the character of leaker Hervé Falciani to support the narrative. Most schemes that involve abnormal sums of money also involve colourful personalities that can be turned into public personas and serve as a backbone for articles.
More research would be needed to estimate the amount of coverage a story receives based on its actual and perceived abnormality. However, our theory -- that stories receive attention from journalists when they can relate them to a situation they know to be normal -- contributes to explaining why some stories receive coverage independently of the quantities at play.
Where do we go from here?
Several tools have been built based on the assumption that large numbers, which are not easily understood, can be explained by providing automated contextualisation. The Dictionary of Numbers, for instance, is a browser extension that automatically finds comparisons for amounts found in articles.
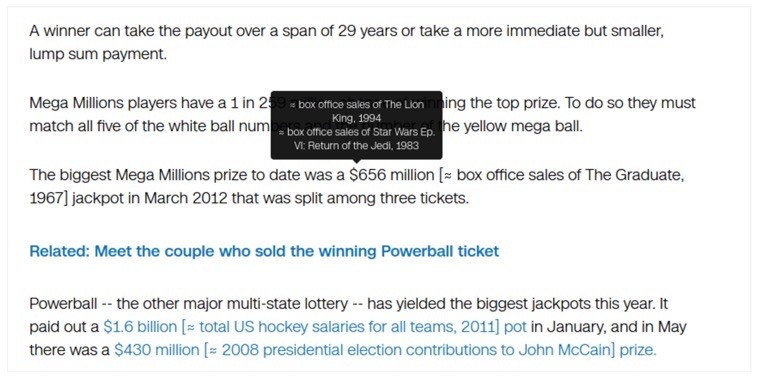
An illustration of Dictionary of Numbers activated in a CNN article.
Another project called Spending Stories, developed by Journalism++ for the Open Knowledge Foundation, was based on the same assumption and offered the same kind of contextualisation. Users could type in any amount and see how it related to other amounts in a database.
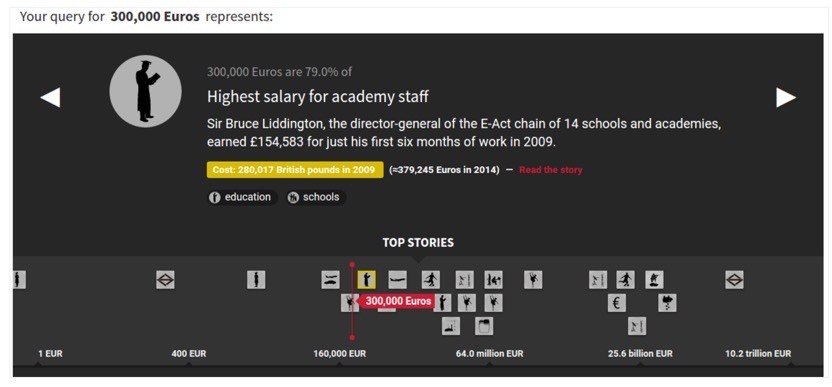
A query for “€300,000” in Spending Stories.
Both the Dictionary of Numbers and Spending Stories assumed that users can better understand an amount when compared to another familiar amount. However, our experiment with the Order of Magnitude Guesser showed that the opposite was true; users are less able to understand amounts when they are compared to other amounts.
This explains the relative failure of both tools. Even if they were positively received upon launch, neither saw much usage. Why? Because they do not help users better understand numbers. To do so would require an automated appreciation of normality. For example, a program that could automatically detect if an amount is within normal bounds. While this might be possible to measure the normality of some domains -- say, a human being who is 2.4m tall is not normal, and neither is a plane that carries more than 200 tons of cargo), automating the detection of abnormal amounts in budget data is impossible.
Rather than tools, improvements in the reporting of large amounts will come from better domain-specific knowledge.
This experiment is part of OpenBudgets.eu, a program financed by the European Commission under grant number 645833.

Communicating large amounts: please, no more football fields - A new strategy is needed
10 min Click to comment